Review
. 2010 Oct;20(4):699-716.
doi: 10.1016/j.giec.2010.07.012.

Advanced systems to assess colonoscopy

Affiliations
Review

Advanced systems to assess colonoscopy

Piet C de Groen. Gastrointest Endosc Clin N Am. 2010 Oct.

Abstract

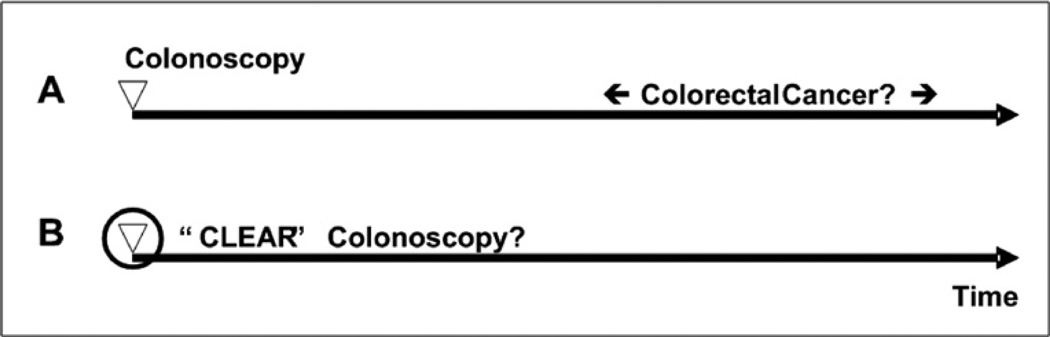
Colorectal cancer is the second major cause of cancer-related death in the United States. The long time involved in progression of mucosal dysplasia from a small polyp to an invasive cancer and the ability to image the colon mucosa are features that make early detection and prevention of colorectal cancer by colonoscopy possible. Although colonoscopy has contributed to a marked decline in the number of colorectal cancer-related deaths, the protective effect of colonoscopy, when used in routine clinical practice, has not lived up to the expectations raised by carefully controlled prospective research studies. Therefore new systems that assess quality of colonoscopy are needed.


Figures

Fig. 1
Fig. 1
Options to measure true quality of colonoscopy. The first option is to determine over time whether or not colorectal cancer occurs despite colonoscopy (A). The second option is to develop technology that can measure whether or not a high-quality colonoscopy was performed based on the entire colonoscopy (B). CLEAR is an acronym for Clean, Look Everywhere and Abnormality Removal, features that define quality of colonoscopy.
Fig. 2
Fig. 2
Screen shot of room use chart for July 2, 2008. Eight endoscopy rooms are listed; blue bars represent the time periods when inside-the-patient events occurred that were detected by EM-Capture and captured and saved as a video files.
Fig. 3
Fig. 3
Screen shot of EM-Manual: frame mode. The left upper frame shows properties of the video, video segments (eg, segmentation based on speech recognition if voice annotation was used during manual video file capture to define colon segments), and annotation tools. The right upper frame shows the consultation panel, allowing annotation of images or components of images. The lower frame shows the various annotation options available. The image component appendix is marked by an ellipse and annotated using MST as “Normal” and Site “Appendix.”
Fig. 4
Fig. 4
Screen shot of EM-Manual: video mode. The upper right frame shows the video panel and the lower frame the Boston bowel preparation scale (BBPS) annotation panel. Rapid review of video files is possible in forward and backward play mode. Speed can be increased or decreased in steps of 2 from normal to 32× normal forward speed or 2× normal backward speed using the “>>” and “<<” buttons. Jumping 10 seconds forward or backward is easily achieved using “>|” and “|<” buttons. Jumps to start and end of the video file can be achieved using “|-“ and “-|” buttons. Jump to a specific frame can be accomplished by entry of the frame number next to “Jump to.” Graphic annotation panels are preferred where possible; in the panel “Prep Out” in the lower frame, a colon model is used for right, transverse, and left colon annotation for BBPS annotation.
Fig. 5
Fig. 5
EM-Manual (APRO) file organization. Video files are stored as *.mpg files. All annotations are stored in a project folder that has the file name of the video file and the file type, “PROJECT.” Within the project folder reside the *.APRO2 file (a second more advanced version of an earlier *.APRO format) and subfolders with images selected for annotation and clips generated. A CLIP folder contains the actual clip and the CLIP PROJECT folder; as for the video project folder, the CLIP PROJECT folder contains the clip *.APRO2 file and an image folder. All annotations are contained within the *.APRO2 files and are combined with the video file and images by loading an *.APRO2 file into EM-Manual.
Fig. 6
Fig. 6
Example of automated stool detection. Region 1 is clear mucosa; regions 2, 3, and 4 are mucosa covered with stool.
Fig. 7
Fig. 7
Quadrant coverage histogram: Circumferential withdrawal: A and C show the spiral shape of the movement of the tip of the endoscope. B and D show the visual field in red. A and B reflect views in which the distant proximal colon is visible; C and D reflect views in which the distant proximal colon is absent and only colon wall is seen. Position 1 shows a left lateral quadrant view, position 2 a superior quadrant view, position 3 a right lateral quadrant view, and position 4 an inferior quadrant view; endoscopic views are from bottom to top of figure. The green bars in A and B indicate the distant proximal colon visible in all positions; hatched green bars in C and D indicate the distant proximal colon that is not visible in any position. The quadrant coverage histogram algorithm counts the number of times the tip of the endoscope passes through all four quadrants at a specific deflexion from the center. (From Liu D, Cao Y, Tavanapong W, et al. Quadrant coverage histogram: a new method for measuring quality of colonoscopic procedures. Conf Proc IEEE Eng Med Biol Soc 2007;1:3470-3; with permission.)
Fig. 8
Fig. 8
Real-time analysis. During real-time analysis, the video stream is analyzed first for inside/outside patient state. If the endoscope is inside a patient, the images are kept in the buffer and analyzed for protruding lesions and quality criteria. Feedback is provided either visually or auditory; the feedback and the response to the feedback are stored and can be imported into the electronic medical record (EMR) if desired.
Fig. 9
Fig. 9
Estimation of mucosal surface area seen. (A) A 2-D view of a relatively straight colon. (B) A 3-D representation in 2-D of (A). (C) A 3-D representation of (A) before fly through of the tip of the endoscope (gray/white cylinder). (D) A 3-D representation of (A) after fly through. Pink areas represent mucosa that can be inspected before fly through (C) and has been inspected after fly through (D) without tip deflection. Green areas represent mucosa that has not been inspected. The simulation estimates that in a relatively straight colon approximately 93% of the mucosal surface can be inspected with fly through without lateral tip deflection (D). (From Hong D, Tavanapong W, Wong J, et al. 3D Reconstruction of colon segments from colonoscopy images. In: IEEE Int’l Conf on Bioinformatics and Bioengineering. Taiwan 2009; p. 53–60.)

Similar articles

Cited by

References

    1. Jemal A, Siegel R, Ward E, et al. Cancer statistics2009. CA Cancer J Clin. 2009;59(4):225–249. - PubMed
    1. Bressler B, Paszat LF, Chen Z, et al. Rates of new or missed colorectal cancers after colonoscopy and their risk factors: a population-based analysis. Gastroenterology. 2007;132(1):96–102. - PubMed
    1. Johnson CD, Fletcher JG, MacCarty RL, et al. Effect of slice thickness and primary 2D versus 3D virtual dissection on colorectal lesion detection at CT colonography in 452 asymptomatic adults. AJR Am J Roentgenol. 2007;189(3):672–680. - PubMed
    1. Baxter NN, Goldwasser MA, Paszat LF, et al. Association of colonoscopy and death from colorectal cancer. Ann Intern Med. 2009;150(1):1. - PubMed
    1. Hewett DG, Kahi CJ, Rex DK. Does colonoscopy work? J Natl Compr Canc Netw. 2010;8(1):67–77. - PubMed

Publication types