

Effect of ICSI on gene expression and development of mouse preimplantation embryos
- PMID: 20889529
- PMCID: PMC2989873
- DOI: 10.1093/humrep/deq266
Effect of ICSI on gene expression and development of mouse preimplantation embryos
Erratum in
- Hum Reprod. 2013 Jan;28(1):285. De Sebastiano, F [corrected to Di Sebastiano, F]
Abstract
Background: In vitro culture (IVC) and IVF of preimplantation mouse embryos are associated with changes in gene expression. It is however not known whether ICSI has additional effects on the transcriptome of mouse blastocysts.
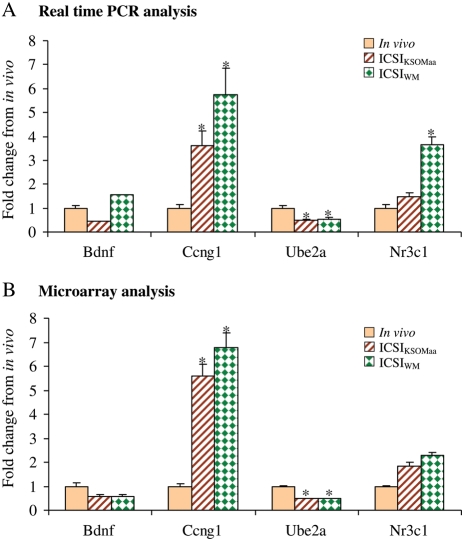
Methods: We compared gene expression and development of mouse blastocysts produced by ICSI and cultured in Whitten's medium (ICSI(WM)) or KSOM medium with amino acids (ICSI(KSOMaa)) with control blastocysts flushed out of the uterus on post coital Day 3.5 (in vivo). In addition, we compared gene expression in embryos generated by IVF or ICSI using WM. Global pattern of gene expression was assessed using the Affymetrix 430 2.0 chip.
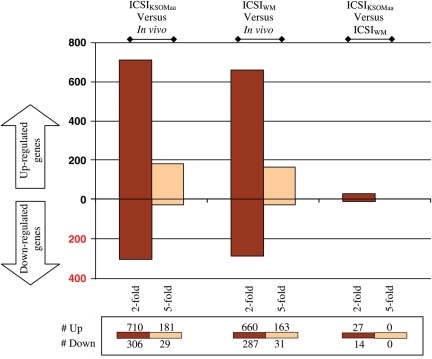
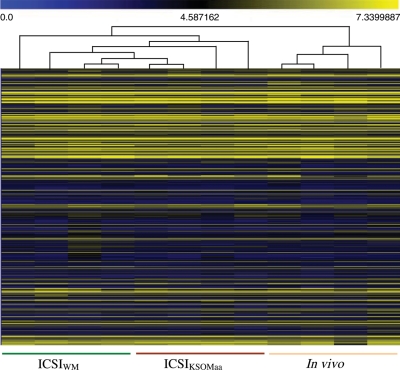
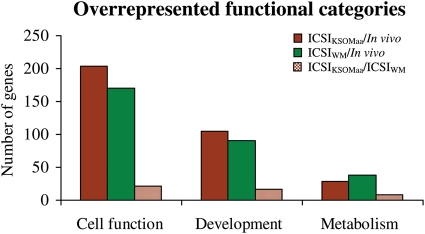
Results: Blastocysts from ICSI fertilization have a reduction in the number of trophoblastic and inner cell mass cells compared with embryos generated in vivo. Approximately 1000 genes are differentially expressed between ICSI blastocyst and in vivo blastocysts; proliferation, apoptosis and morphogenetic pathways are the most common pathways altered after IVC. Unexpectedly, expression of only 41 genes was significantly different between embryo cultured in suboptimal conditions (WM) or optimal conditions (KSOM(aa)).
Conclusions: Our results suggest that fertilization by ICSI may play a more important role in shaping the transcriptome of the developing mouse embryo than the culture media used.
Figures
References
-
- Adamson SL, Lu Y, Whiteley KJ, Holmyard D, Hemberger M, Pfarrer C, Cross JC. Interactions between trophoblast cells and the maternal and fetal circulation in the mouse placenta. Dev Biol. 2002;250:358–73. - PubMed
-
- Andang M, Hjerling-Leffler J, Moliner A, Lundgren TK, Castelo-Branco G, Nanou E, Pozas E, Bryja V, Halliez S, Nishimaru H, et al. Histone H2AX-dependent GABA(A) receptor regulation of stem cell proliferation. Nature. 2008;451:460–464. - PubMed
-
- Anthony SBS, Dorrepaal C, Lindner K, Braat D, Ouden A. Congenital malformations in 4224 children conceived after IVF. Hum Reprod. 2002;17:2089–2095. - PubMed
-
- Barker DJ. Mothers, Babies and Health in Later Life. 2nd edn. Glasgow: Churchill Livingstone; 1998.
-
- Bedford SJ, Kurokawa M, Hinrichs K, Fissore RA. Intracellular calcium oscillations and activation in horse oocytes injected with stallion sperm extracts or spermatozoa. Reproduction. 2003;126:489–499. - PubMed
Publication types
MeSH terms
Substances
Grants and funding
LinkOut - more resources
Full Text Sources
Molecular Biology Databases
