. 2010 Nov 1;185(9):5225-35.
doi: 10.4049/jimmunol.1001116. Epub 2010 Oct 1.

Apoptotic cells activate NKT cells through T cell Ig-like mucin-like-1 resulting in airway hyperreactivity

Affiliations

Apoptotic cells activate NKT cells through T cell Ig-like mucin-like-1 resulting in airway hyperreactivity

Hyun-Hee Lee et al. J Immunol. .

Abstract

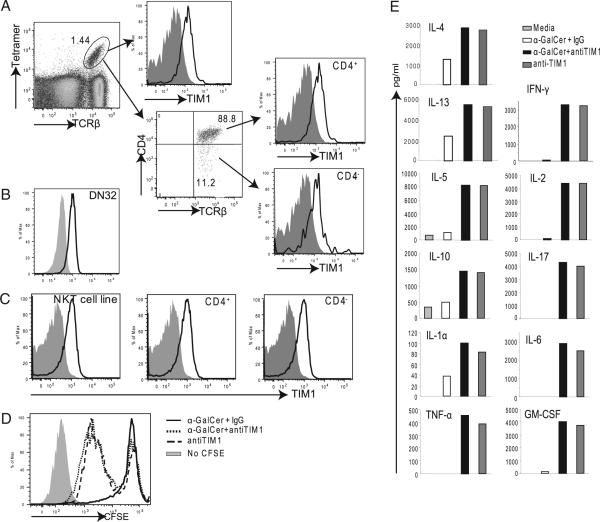
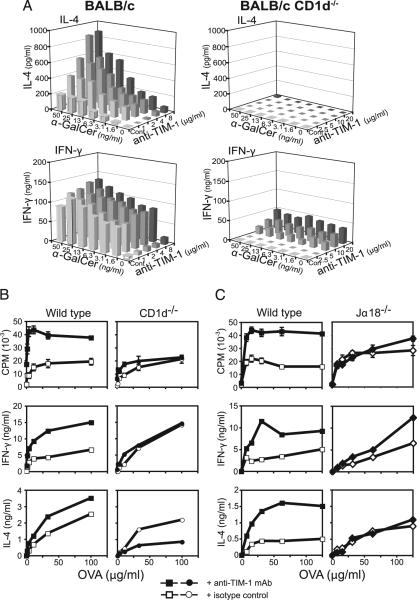
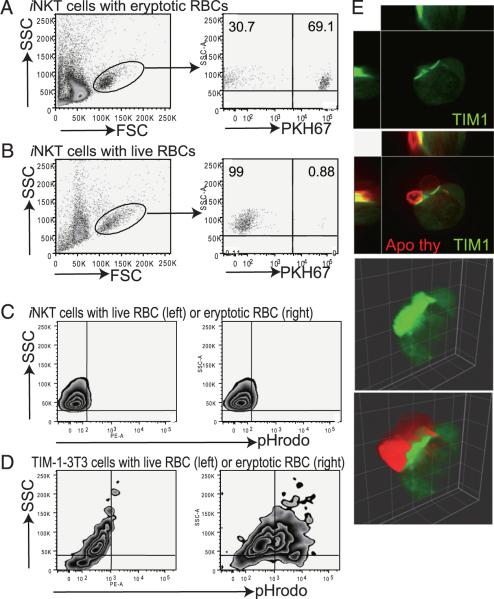
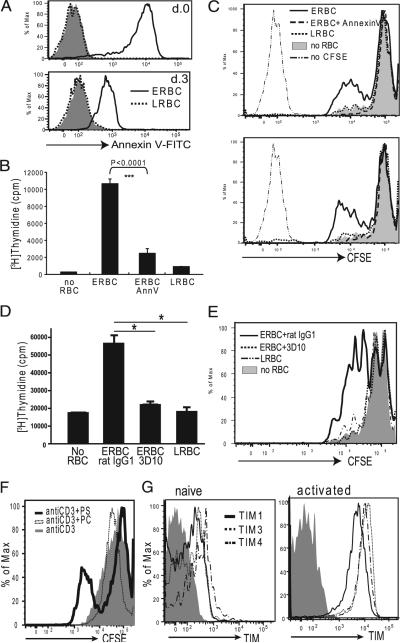
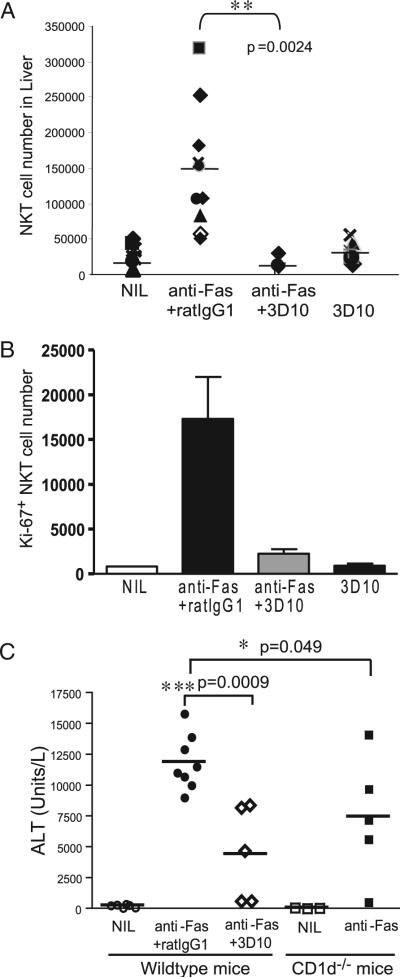
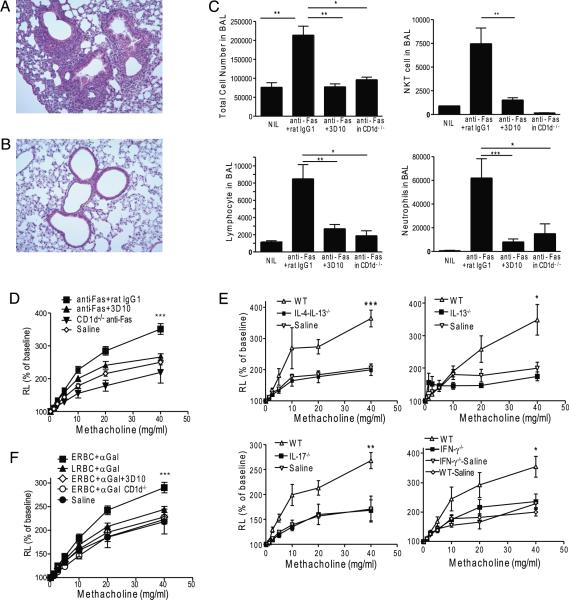
T cell Ig-like mucin-like-1 (TIM-1) is an important asthma susceptibility gene, but the immunological mechanisms by which TIM-1 functions remain uncertain. TIM-1 is also a receptor for phosphatidylserine (PtdSer), an important marker of cells undergoing programmed cell death, or apoptosis. We now demonstrate that NKT cells constitutively express TIM-1 and become activated by apoptotic cells expressing PtdSer. TIM-1 recognition of PtdSer induced NKT cell activation, proliferation, and cytokine production. Moreover, the induction of apoptosis in airway epithelial cells activated pulmonary NKT cells and unexpectedly resulted in airway hyperreactivity, a cardinal feature of asthma, in an NKT cell-dependent and TIM-1-dependent fashion. These results suggest that TIM-1 serves as a pattern recognition receptor on NKT cells that senses PtdSer on apoptotic cells as a damage-associated molecular pattern. Furthermore, these results provide evidence for a novel innate pathway that results in airway hyperreactivity and may help to explain how TIM-1 and NKT cells regulate asthma.


Figures

FIGURE 1
FIGURE 1
TIM-1 is constitutively expressed on NKT cells and costimulates NKT cells. A, Spleen cells from BALB/c mice were stained with CD1d-tetramers and anti-TCRb to identify iNKT cells, which were shown to express TIM-1, as stained with a PE-coupled TIM-1 specific mAb, 3B3. CD4+ and CD4 subpopulations of iNKT cells were further distinguished by flow cytometry, and both subpopulations expressed TIM-1. Gray-filled histograms represents staining with isotype control (rat IgG2a) for anti–TIM-1. B, TIM-1 is expressed on the surface of DN32.D3 NKT cell hybridoma cells. C, TIM-1 on an iNKT cell line. TIM-1 expression on the total iNKT cell line (left panel), CD4+ subset (middle panel), and CD4 subset (right panel). Gray-filled histogram represents staining with isotype control (rat IgG2a) for anti–TIM-1. The data are representative of three experiments. D, iNKT cell lines were labeled with CFSE and cultured for 60 h with media; plate-bound anti–TIM-1 mAb (no DC); anti–TIM-1 mAb + a suboptimal concentration of α-GalCer (1 ng/ml); or rat IgG + α-GalCer. DCs were added to all wells receiving α-GalCer. E, iNKT cell lines were cultured as in D for 48 h, and supernatants were collected for cytokine analysis using ELISA and Cytometric Bead Array. The data are representative of two experiments.
FIGURE 2
FIGURE 2
TIM-1 costimulation activates NKT cells in vivo A, Whole splenocyte cultures (2.0 × 10⁶ cells per well) from wild-type (left panels) or CD1d−/− (right panels) were incubated for 20–24 h with α-GalCer (0–50 ng/ml) and/or soluble anti–TIM-1 activating Ab (3B3; 0–8 μg/ml for BALB/c and 0–20 μg/ml for CD1d−/− mice), after which supernatants were collected and the cytokines IL-4 (upper panels) and IFN-γ (lower panels) were evaluated by ELISA. Control cultures contained isotype control (20 μg/ml). Data are representative of four experiments. B, Wild-typeBALB/c(left column)orCD1d−/− (right column) mice were immunized s.c. with OVA (300 μg in incomplete Freund's adjuvant) 6 h after treatment with anti–TIM-1 mAb (3B3; 200 μg per mouse, filled symbols) or isotype control (rat IgG2a; open symbols). Draining lymph nodes were removed after 8 d and B cell-depleted spleen cells cultured with increasing concentrations of OVA. Cell proliferation (top panels) was assessed after 72 h by incorporation of [3H]thymidine (4 × 10⁵ cells/well). Culture supernatants were obtained after 4 d and assessed for IFN-γ and IL-4 production by ELISA. Data are representative of three experiments. C, Experiments were performed as described in B but with Jα18−/− mice rather than CD1d−/− mice. Data are representative of three experiments. CPM, counts per minute.
FIGURE 3
FIGURE 3
iNKT cells bind but do not engulf ERBCs A, ERBCs were labeled with the fluorescent dye PKH67 and cultured with iNKT cell lines for 1 h. The left panel shows gating strategy for the iNKT cell population. The right panel shows that ERBCs were associated/bound to most of the iNKT cells. B, Fresh LRBCs were labeled with PKH67 and cultured with iNKT cell lines as in A. The left panel shows gating strategy for the iNKT cell population. The right panel shows that the LRBCs were not associated with the iNKT cells. C, LRBCs (left panel) or ERBCs (right panel) were labeled with the fluorescent dye pHrodo, which is colorless at pH 7 but turns red (detected in PE-channel) in the acidic environment of endosomes. LRBCs or ERBCs were cultured with iNKT cell lines, but the RBCs remained colorless, indicating that none of the RBCs were phagocytosed by the iNKT cells. D, LRBCs (left panel) or ERBCs (right panel) were labeled with pHrodo and cultured with TIM-1–transfected 3T3 cells. The right panel shows that the ERBCs are detected in the PE-channel, indicating that the ERBCs, but not the LRBCs, were phagocytosed into endosomes by the TIM-1–transfected 3T3 cells. The data are representative of two experiments. E, TIM-1 aggregates at the T cell-apoptotic cell synaptic interface. DO11 T hybridoma cells were transfected with YFP–TIM-1 and incubated with Vibrant DID-labeled apoptotic thymocytes (red). After 30 min, live cell confocal images were obtained, showing a bright YFP–TIM-1 cap (green) at the synaptic interface. In the top two panels, XZ and XY orthogonal planes were created using the “interpolation” and “3-view” features in Slidebook. For the bottom figure, the three-dimensional volume rendering was also created in Slidebook using the Dynamic Lighting volume rendering style. The percentage of DO11.10 cells with polarized (capped) TIM-1 in the presence of apoptotic thymocytes was 72%, whereas the percentage of cells at baseline with polarized TIM-1 was 30%. p < 0.001. The background of 30% may be due to the presence of apoptotic DO11.10 cells, which could also cap TIM-1. FSC, forward scatter; SSC, side scatter.
FIGURE 4
FIGURE 4
ERBCs activate iNKT cells A, Level of PtdSer on the ERBC or LRBC surface was measured using annexin V-FITC on day 0 (d.0) and on day 3 (d.3) of culture. The data are representative of three experiments. B, iNKT cell lines (5 × 10⁴) were cultured in plates coated with a suboptimal concentration of anti-CD3 mAb (1 μg/ml) (in all wells) along with ERBCs or LRBCs (0.5 × 10⁶) for 48 h. Activation of iNKT cells was assessed by [3H]thymidine incorporation. Proliferation induced with ERBCs was blocked by the addition of annexin V (AnnV; 5 μg/ml). p < 0.0001. The data are representative of three experiments. C, Proliferation of NKT cells was assessed by CFSE dilution. Cultures were performed as in B along with 0.5 × 10⁶ (upper panel) or 1.0 × 10⁶ (lower panel) ERBCs or LRBCs for 72 h. Activation with ERBCs was blocked by the addition of annexin V (5 μg/ml). The data are representative of three experiments. D, The proliferation of iNKT cell lines induced with ERBCs was prevented by addition of a blocking anti–TIM-1 mAb (3D10), as assessed by [3H]thymidine incorporation. p < 0.0003. Cultures were performed as in B but a blocking anti–TIM-1 mAb 3D10 or control rat IgG (20 μg/ml) was added to the cultures. The data are representative of three experiments. E, The proliferation of iNKT cell lines induced with ERBCs was assessed by CFSE dilution. Cultures were performed as in C (0.25 × 10⁶ ERBCs added), but a blocking anti–TIM-1 mAb 3D10 or control rat IgG (20 μg/ml) was added to the cultures. The data are representative of three experiments. F, PtdSer liposomes, but not PC liposomes, costimulate iNKT cell proliferation. iNKT cells labeled with CFSE were cultured with suboptimal levels of anti-CD3 mAb and either PtdSer liposomes (100 μM) or PC liposomes (100 μM). G, iNKT cells express TIM-1, TIM-3, and TIM-4 on the surface. iNKT cells were labeled with specific Abs of TIMs conjugated with APCs. Gray area represents cells with isotype control. The data are representative of three experiments.
FIGURE 5
FIGURE 5
Apoptotic cells activate iNKT cells in vivo. A, Hepatocyte apoptosis was induced using anti-Fas as described in Materials and Methods. Sixty hours later, mice were sacrificed, and iNKT cells in the liver were analyzed. iNKT cells were identified by staining with CD1d-tetramers and anti-TCRβ. Five to 10 mice per group were used. **p = 0.0024, comparing anti–TIM-1 treatment with control. Each symbol represents a single mouse. B, Increased expression of Ki-67, a marker of proliferating cells, was noted in liver iNKT cells from mice treated with anti-Fas mAb, but not when a blocking anti–TIM-1 mAb 3D10 was given. Mice were treated as in A. C, Wild-type and CD1d−/− mice were treated as in A. Serum from mice was sampled at 18 h and tested for ALT activity. Five to eight mice per group were used. The data are representative of three experiments. The p values are the result of the statistical Student t test.
FIGURE 6
FIGURE 6
Apoptotic cells induce airway inflammation and AHR. A and B, Increased airway inflammation in anti-Fas–treated mice (A) but not in control mice (B). BALB/c mice were treated intranasally with anti-Fas mAb (5 μg in 0.9% saline) or saline to induce apoptosis of lung epithelial cell. After 24 h, lungs were collected and fixed with 10% formaldehyde for 24 h. Parafilm-embedded lung sections were stained with H&E and analyzed for cell infiltration. Anti-Fas mAb-treated mice show an intense inflammatory infiltrate in the peribronchial space and an increase in the size of the airway epithelial cells (original magnification ×200). C, Wild-type BALB/c and CD1d−/− mice were treated with anti-Fas intranasally as in A and B. Seventy-two hours later, mice were sacrificed, and iNKT cells in BAL fluid were analyzed using CD1d-tetramers and anti-TCRβ. Three to four mice per group were used. The data are representative of four experiments. D, Mice were treated as in A. Forty-eight hours later, AHR was assessed by invasive measurement of airway resistance. Three to 16 mice per group were used. ***p < 0.001, compared with saline control. E, Cytokine knockout mice fail to develop anti-Fas–induced AHR. Mice were treated as in A. Forty-eight hours later, AHR was assessed by invasive measurement of airway resistance. Five to 10 mice per group were used. F, Wild-type BALB/c mice were treated intranasally with ERBCs and LRBCs as discussed in Materials and Methods. CD1d−/− mice were also treated intranasally (ERBCs + α-GalCer). Twenty-four hours later, AHR was assessed as in B. Three to 18 mice per group were used. ***p < 0.001, compared with saline control. RL, lung resistance; WT, wild type.

Similar articles

Cited by

References

    1. McIntire JJ, Umetsu SE, Macaubas C, Hoyte EG, Cinnioglu C, Cavalli-Sforza LL, Barsh GS, Hallmayer JF, Underhill PA, Risch NJ, et al. Immunology: hepatitis A virus link to atopic disease. Nature. 2003;425:576. - PubMed
    1. Chae SC, Song JH, Shim SC, Yoon KS, Chung HT. The exon 4 variations of Tim-1 gene are associated with rheumatoid arthritis in a Korean population. Biochem. Biophys. Res. Commun. 2004;315:971–975. - PubMed
    1. Freeman GJ, Casasnovas JM, Umetsu DT, DeKruyff RH. TIM genes: a family of cell surface phosphatidylserine receptors that regulate innate and adaptive immunity. Immunol. Rev. 2010;235:172–189. - PMC - PubMed
    1. McIntire JJ, Umetsu SE, Akbari O, Potter M, Kuchroo VK, Barsh GS, Freeman GJ, Umetsu DT, DeKruyff RH. Identification of Tapr (an airway hyperreactivity regulatory locus) and the linked Tim gene family. Nat. Immunol. 2001;2:1109–1116. - PubMed
    1. Umetsu SE, Lee WL, McIntire JJ, Downey L, Sanjanwala B, Akbari O, Berry GJ, Nagumo H, Freeman GJ, Umetsu DT, DeKruyff RH. TIM-1 induces T cell activation and inhibits the development of peripheral tolerance. Nat. Immunol. 2005;6:447–454. - PubMed

Publication types

MeSH terms