Carcinoembryonic antigen interacts with TGF-{beta} receptor and inhibits TGF-{beta} signaling in colorectal cancers
- PMID: 20889724
- PMCID: PMC3001246
- DOI: 10.1158/0008-5472.CAN-10-1073
Carcinoembryonic antigen interacts with TGF-{beta} receptor and inhibits TGF-{beta} signaling in colorectal cancers
Abstract
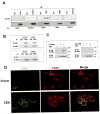
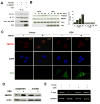
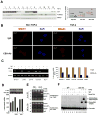
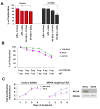
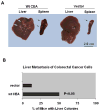
As a tumor marker for colorectal cancers, carcinoembryonic antigen (CEA) enhances the metastatic potential of cancer cells. CEA functions as an intercellular adhesion molecule and is upregulated in a wide variety of human cancers. However, the molecular mechanisms by which CEA mediates metastasis remain to be understood. Transforming growth factor-β (TGF-β) signaling regulates both tumor suppression and metastasis, and also contributes to the stimulation of CEA transcription and secretion in colorectal cancer cells. However, it remains unknown whether CEA, in turn, influences TGF-β functions and if a regulatory cross-talk exists between CEA and the TGF-β signaling pathway. Here, we report that CEA directly interacts with TGF-β receptor and inhibits TGF-β signaling. Targeting CEA with either CEA-specific antibody or siRNA rescues TGF-β response in colorectal cancer cell lines with elevated CEA, thereby restoring the inhibitory effects of TGF-β signaling on proliferation. CEA also enhances the survival of colorectal cancer cells in both local colonization and liver metastasis in animal study. Our study provides novel insights into the interaction between CEA and TGF-β signaling pathway and establishes a negative feedback loop in amplifying the progression of colon cancer cells to more invasive phenotypes. These findings offer new therapeutic opportunities to inhibit colorectal cancer cell proliferation by cotargeting CEA in promoting tumor-inhibitory action of the TGF-β pathway.
Figures
Similar articles
-
Crosstalk of carcinoembryonic antigen and transforming growth factor-β via their receptors: comparing human and canine cancer.Cancer Immunol Immunother. 2015 May;64(5):531-7. doi: 10.1007/s00262-015-1684-6. Epub 2015 Apr 2. Cancer Immunol Immunother. 2015. PMID: 25832000 Free PMC article. Review.
-
CEACAM5 and CEACAM6 are major target genes for Smad3-mediated TGF-beta signaling.Oncogene. 2008 Jan 24;27(5):675-83. doi: 10.1038/sj.onc.1210686. Epub 2007 Jul 23. Oncogene. 2008. PMID: 17653079
-
IL-6 signaling promotes tumor growth in colorectal cancer.Cell Cycle. 2005 Feb;4(2):217-20. Epub 2005 Feb 3. Cell Cycle. 2005. PMID: 15655344
-
The Genome-Wide Analysis of Carcinoembryonic Antigen Signaling by Colorectal Cancer Cells Using RNA Sequencing.PLoS One. 2016 Sep 1;11(9):e0161256. doi: 10.1371/journal.pone.0161256. eCollection 2016. PLoS One. 2016. PMID: 27583792 Free PMC article.
-
Role of the transforming growth factor-β signaling pathway in the pathogenesis of colorectal cancer.J Cell Biochem. 2019 Jun;120(6):8899-8907. doi: 10.1002/jcb.28331. Epub 2018 Dec 16. J Cell Biochem. 2019. PMID: 30556274 Review.
Cited by
-
Identification of CEA-interacting proteins in colon cancer cells and their changes in expression after irradiation.Radiat Oncol J. 2017 Sep;35(3):281-288. doi: 10.3857/roj.2017.00255. Epub 2017 Sep 15. Radiat Oncol J. 2017. PMID: 28881503 Free PMC article.
-
Crosstalk of carcinoembryonic antigen and transforming growth factor-β via their receptors: comparing human and canine cancer.Cancer Immunol Immunother. 2015 May;64(5):531-7. doi: 10.1007/s00262-015-1684-6. Epub 2015 Apr 2. Cancer Immunol Immunother. 2015. PMID: 25832000 Free PMC article. Review.
-
Targeting TGF-β signaling in cancer.Expert Opin Ther Targets. 2013 Jul;17(7):743-60. doi: 10.1517/14728222.2013.782287. Epub 2013 May 7. Expert Opin Ther Targets. 2013. PMID: 23651053 Free PMC article. Review.
-
Epigenetic silencing of EYA2 in pancreatic adenocarcinomas promotes tumor growth.Oncotarget. 2014 May 15;5(9):2575-87. doi: 10.18632/oncotarget.1842. Oncotarget. 2014. PMID: 24810906 Free PMC article.
-
The EMT spectrum and therapeutic opportunities.Mol Oncol. 2017 Jul;11(7):878-891. doi: 10.1002/1878-0261.12082. Epub 2017 Jun 19. Mol Oncol. 2017. PMID: 28544151 Free PMC article. Review.
References
-
- Nollau P, Scheller H, Kona-Horstmann M, et al. Expression of CD66a (human C-CAM) and other members of the carcinoembryonic antigen gene family of adhesion molecules in human colorectal adenomas. Cancer Res. 1997;57:2354–2357. - PubMed
-
- Rosenberg M, Nedellec P, Jothy S, Fleiszer D, Turbide C, Beauchemin N. The expression of mouse biliary glycoprotein, a carcinoembryonic antigen-related gene, is down-regulated in malignant mouse tissues. Cancer Res. 1993;53:4938–4945. - PubMed
-
- Benchimol S, Fuks A, Jothy S, Beauchemin N, Shirota K, Stanners CP. Carcinoembryonic antigen, a human tumor marker, functions as an intercellular adhesion molecule. Cell. 1989;57:327–334. - PubMed
-
- Oikawa S, Inuzuka C, Kuroki M, Matsuoka Y, Kosaki G, Nakazato H. Cell adhesion activity of non-specific cross-reacting antigen (NCA) and carcinoembryonic antigen (CEA) expressed on CHO cell surface: homophilic and heterophilic adhesion. Biochem Biophys Res Commun. 1989;164:39–45. - PubMed
-
- Stanners CP. F. A. Properties of adhesion mediated by the human CEA family. Cell Adhesion and Communication Mediated by the CEA Family: Basic and Clinical Perspectives. 1998;Chapter 3:57–71.
Publication types
MeSH terms
Substances
Grants and funding
LinkOut - more resources
Full Text Sources
Medical
Research Materials

