. 2010 Dec 3;285(49):38125-40.
doi: 10.1074/jbc.M110.148650. Epub 2010 Oct 2.

Basis for MAP4 dephosphorylation-related microtubule network densification in pressure overload cardiac hypertrophy

Affiliations

Basis for MAP4 dephosphorylation-related microtubule network densification in pressure overload cardiac hypertrophy

Guangmao Cheng et al. J Biol Chem. .

Abstract

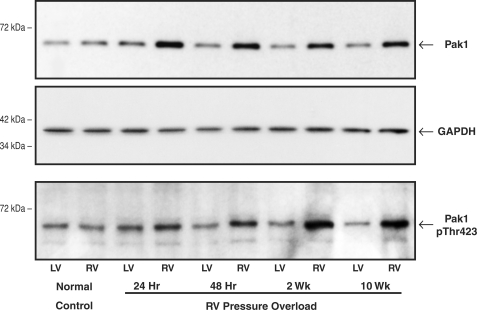
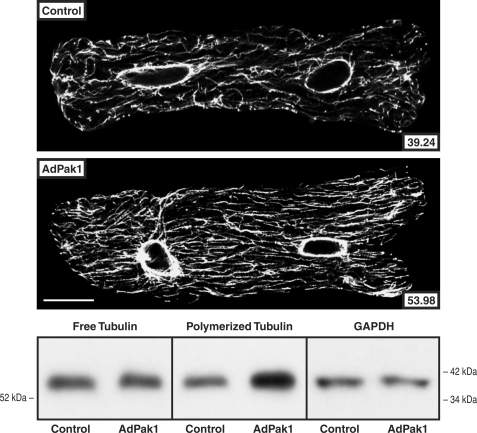
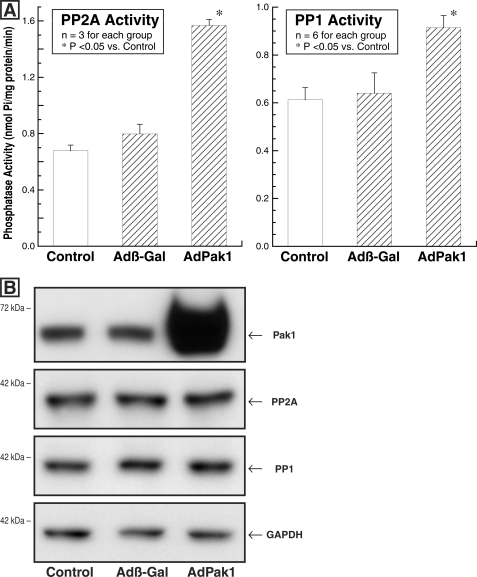
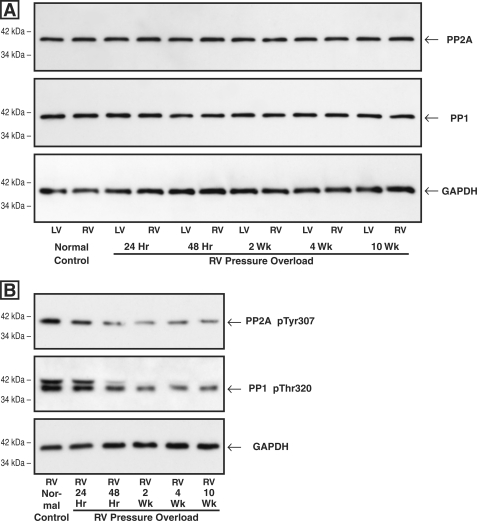
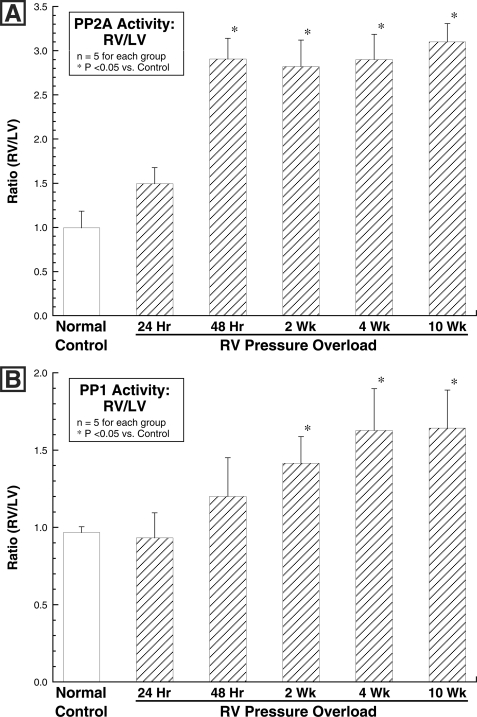
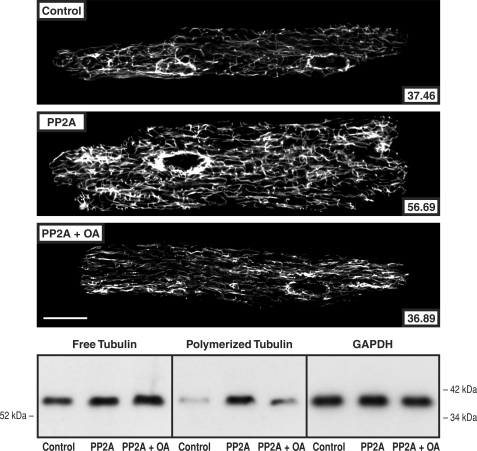
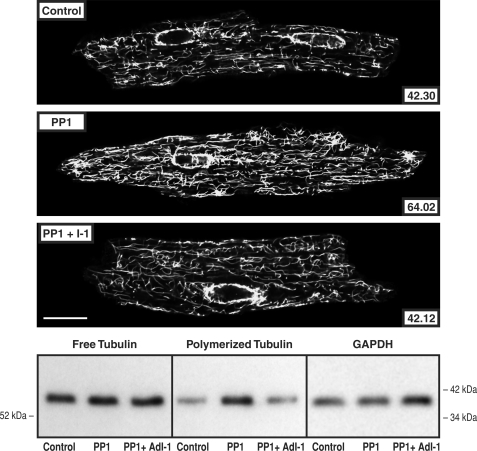
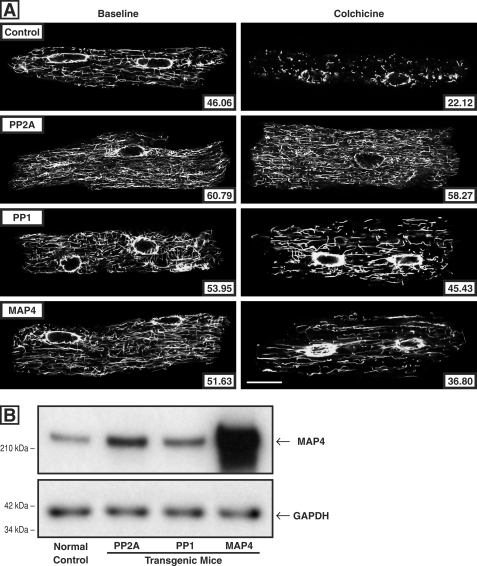
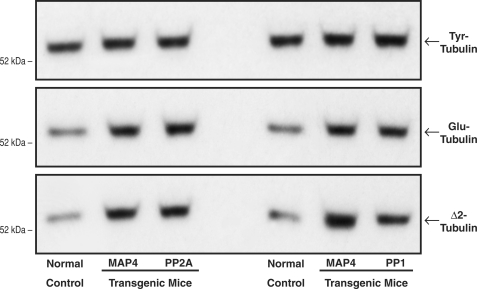
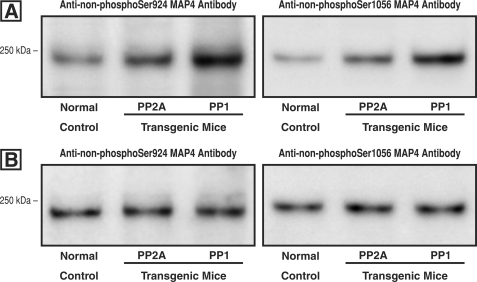
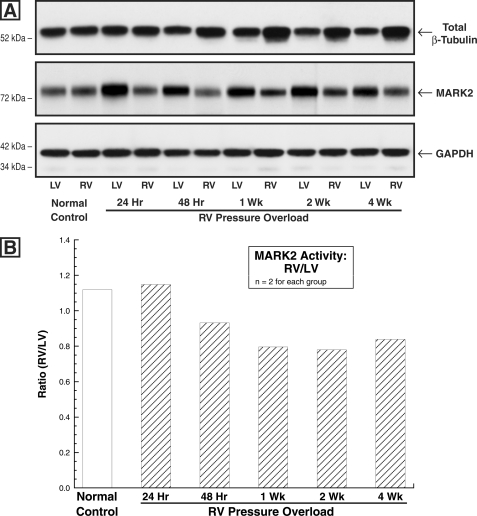
Increased activity of Ser/Thr protein phosphatases types 1 (PP1) and 2A (PP2A) during maladaptive cardiac hypertrophy contributes to cardiac dysfunction and eventual failure, partly through effects on calcium metabolism. A second maladaptive feature of pressure overload cardiac hypertrophy that instead leads to heart failure by interfering with cardiac contraction and intracellular transport is a dense microtubule network stabilized by decoration with microtubule-associated protein 4 (MAP4). In an earlier study we showed that the major determinant of MAP4-microtubule affinity, and thus microtubule network density and stability, is site-specific MAP4 dephosphorylation at Ser-924 and to a lesser extent at Ser-1056; this was found to be prominent in hypertrophied myocardium. Therefore, in seeking the etiology of this MAP4 dephosphorylation, we looked here at PP2A and PP1, as well as the upstream p21-activated kinase 1, in maladaptive pressure overload cardiac hypertrophy. The activity of each was increased persistently during maladaptive hypertrophy, and overexpression of PP2A or PP1 in normal hearts reproduced both the microtubule network phenotype and the dephosphorylation of MAP4 Ser-924 and Ser-1056 seen in hypertrophy. Given the major microtubule-based abnormalities of contractile and transport function in maladaptive hypertrophy, these findings constitute a second important mechanism for phosphatase-dependent pathology in the hypertrophied and failing heart.


Figures

FIGURE 1.
FIGURE 1.
Myocardial total Pak1 and active Pak1 phosphorylated on Thr-423. These immunoblots were prepared from myocardial homogenates from the RV and LV of control cats and RV pressure-overloaded cats at the specified times after PAB. The blots were prepared using a polyclonal anti-Pak1 (α-Pak) antibody (sc-881; Santa Cruz Biotechnology), a polyclonal anti-Thr(P)-423 Pak1 antibody (catalog number 2601S; Cell Signaling), and, as a loading control, a monoclonal anti-GAPDH antibody (clone 6C5; Upstate Biotech). For three experiments such as that shown here, the densitometric ratio of RV/LV Pak1 was 1.32 ± 0.02 for control, 1.72 ± 0.03 for 24-h PAB, 1.71 ± 0.02 for 48-h PAB, 1.70 ± 0.02 for 2-week PAB, and 1.77 ± 0.03 for 10-week PAB. For the ratio of RV/LV p-Pak1, these values were 1.00 ± 0.05 for control, 1.17 ± 0.09 for 24-h PAB, 1.83 ± 0.13 for 48-h PAB, 2.45 ± 0.25 for 2-week PAB, and 2.96 ± 0.20 for 10-week PAB. For the ratio of RV pPak1/RV Pak1, these values were 1.20 ± 0.31 for control, 0.81 ± 0.34 for 24-h PAB, 1.05 ± 0.30 for 48-h PAB, 2.05 ± 0.37 for 2-week PAB, and 1.94 ± 0.39 for 10-week PAB.
FIGURE 2.
FIGURE 2.
Cardiomyocyte free and polymerized tubulin after AdPak1 infection. These confocal micrographs and immunoblots were prepared from cultured quiescent adult feline cardiomyocytes infected 48 h earlier with AdPak1, an adenovirus encoding constitutively active Pak1, at a multiplicity of infection of ∼1. Control cells were infected at the same multiplicity of infection with AdβGal, an adenovirus encoding bacterial β-galactosidase, and additional controls for these adenovirus infection data are provided in supplemental Fig. S1. The greater microtubule network density and concentration of polymerized tubulin in the AdPak1-infected cells is apparent. A monoclonal anti-β-tubulin antibody (clone DM-1B; Abcam) was used for the micrographs and immunoblots, and for the immunoblot loading control, a monoclonal anti-GAPDH antibody (clone 6C5; Upstate Biotech) was used for the same samples as used for free tubulin. The number inset into each micrograph gives the mean pixel intensity (white level) of the microtubule network within the boundary of that cell; each micrograph is a single 0.1-μm confocal section taken at the level of the nuclei. For this and two other immunoblots, the densitometric ratio of AdPak1/control signals was 0.96 ± 0.05 for free tubulin and 2.19 ± 0.13 for polymerized tubulin. Scale bar, 20 μm.
FIGURE 3.
FIGURE 3.
Cardiomyocyte PP2A and PP1 activity and quantity after AdPak1 infection. The feline cardiomyocytes used for these assays were either uninfected (control) or infected with AdPak1 or Adβ-gal 72 h earlier. A, PP2A activity was measured using an immunoprecipitation assay kit (catalog number 17-313; Upstate Biotech) as described under “Experimental Procedures.” PP1 activity was determined using the PSP assay system (catalog number P0780S; New England Biolabs), as is also described under “Experimental Procedures.” B, these immunoblots were prepared from the same cardiomyocyte lysates used for the PP2A and PP1 activity assays. The blots were prepared using a polyclonal anti-Pak1 (α-Pak) antibody (sc-881; Santa Cruz Biotechnology), a monoclonal antibody to the catalytic subunit of PP2A (clone 1D6; Upstate Biotech), a monoclonal antibody to PP1 (clone E-9; Santa Cruz Biotechnology), and, as the loading control, a monoclonal antibody to GAPDH (clone 6C5; Upstate Biotech). *, p < 0.05 by one-way ANOVA with Bonferroni post hoc analysis.
FIGURE 4.
FIGURE 4.
Myocardial levels of total and inactive PP2A and PP1 after RV pressure overloading. Myocardial homogenates used for all of these blots were prepared from the same-animal RVs and LVs at the indicated times after hypertrophy induction via PAB. A, levels of total PP2A and PP1. The antibodies used for these blots were a monoclonal antibody to the catalytic subunit of PP2A (clone 1D6; Upstate Biotech), a monoclonal antibody to PP1 (clone E-9; Santa Cruz Biotechnology), and, as the loading control, a monoclonal antibody to GAPDH (clone 6C5; Upstate Biotech). The densitometric ratio of RV/LV PP2A and PP1 signals in this and two other sets of immunoblots did not differ more than 10% from unity at any time point. B, levels of inactive PP2A and PP1. The antibodies used for these blots were a phosphopeptide antibody to inactive PP2A Tyr(P)-307 (clone E155; Epitomics), a phosphopeptide antibody to inactive PP1 Thr(P)-320 (clone EP1512Y; Epitomics), and, as the loading control, a monoclonal antibody to GAPDH (clone 6C5; Upstate Biotech). In this and one other PP2A Tyr(P)-307 blot, the average ratio of pressure-overloaded RV/control RV was 0.77 for the 24-h RV, 0.47 for the 48-h RV, 0.36 for the 2-week RV, 0.50 for the 4-week RV, and 0.39 for the 10-week RV; in this and one other PP1 Thr(P)-320 blot, the average ratio of pressure-overloaded RV/control RV was 0.81 for the 24-h RV, 0.60 for the 48-h RV, 0.46 for the 2-week RV, 0.43 for the 4-week RV, and 0.45 for the 10-week RV.
FIGURE 5.
FIGURE 5.
Myocardial activity of PP2A and PP1 after RV pressure overloading. Myocardial homogenates for these assays were prepared from the same animals as those used to prepare the immunoblots in Fig. 4. A, PP2A activity was measured using an immunoprecipitation assay kit (catalog number 17-313; Upstate Biotech) as described under “Experimental Procedures.” B, PP1 activity was determined using the PSP assay system (catalog number P0780S; New England Biolabs), as is also described under “Experimental Procedures.” *, p < 0.05 by one-way ANOVA with Bonferroni post hoc analysis.
FIGURE 6.
FIGURE 6.
Cardiomyocyte free and polymerized tubulin in mice overexpressing PP2A. Microtubule network density and free and polymerized β-tubulin in cardiomyocytes isolated from control mice, from mice having cardiac-restricted overexpression of PP2A, and the same cells treated for 8 h with 10 nm okadaic acid. The greater microtubule network density and concentration of polymerized tubulin in the PP2A mice are returned to control by okadaic acid. The antibody used for the confocal micrographs and tubulin immunoblots was a monoclonal anti-β-tubulin antibody (clone DM-1B; Abcam). For the immunoblot loading control, a monoclonal anti-GAPDH antibody (clone 6C5; Upstate Biotech) was used in the same samples as those used for free tubulin. For the confocal micrographs, the mean pixel intensity (white level) within the boundary of each cardiomyocyte is given numerically; each micrograph is a single 0.1-μm confocal section taken at the level of the nuclei. For this and two other immunoblots, the densitometric ratio of PP2A/control signals was 1.24 ± 0.03 for free tubulin and 4.91 ± 0.56 for polymerized tubulin; for PP2A + OA/control, it was 1.39 ± 0.02 for free tubulin and 2.19 ± 0.38 for polymerized tubulin. Scale bar, 20 μm.
FIGURE 7.
FIGURE 7.
Cardiomyocyte free and polymerized tubulin in mice overexpressing PP1. Microtubule network density and free and polymerized β-tubulin in cardiomyocytes isolated from control mice, from mice having cardiac-restricted overexpression of PP1, and the same isolated cells infected for 48 h with AdI-1, an adenovirus encoding PP1 I-1, the endogenous inhibitor of PP1. The greater microtubule network density and concentration of polymerized tubulin in the PP2A mice is returned to control by PP1 I-1 expression. The antibody used for the confocal micrographs and tubulin immunoblots was a monoclonal anti-β-tubulin antibody (clone DM-1B; Abcam). For the immunoblot loading control, a monoclonal anti-GAPDH antibody (clone 6C5; Upstate Biotech) was used in the same samples as those used for free tubulin. For the confocal micrographs, the mean pixel intensity (white level) within the boundary of each cardiomyocyte is given numerically; each micrograph is a single 0.1-μm confocal section taken at the level of the nuclei. For this and two other immunoblots, the densitometric ratio of PP1/control signals was 1.08 ± 0.05 for free tubulin and 2.04 ± 0.09 for polymerized tubulin; for PP1 + I-1/control, it was 1.08 ± 0.03 for free tubulin and 0.92 ± 0.05 for polymerized tubulin. Scale bar, 20 μm.
FIGURE 8.
FIGURE 8.
Cardiomyocyte microtubule network density and stability. A, confocal micrographs of cardiomyocytes isolated from the hearts of control and colchicine-treated mice. For these micrographs, prepared using a monoclonal anti-β-tubulin antibody (clone DM-1B; Abcam), the left column shows cardiomyocytes isolated from vehicle-treated mice, and the right column shows cardiomyocytes isolated from colchicine-treated mice (0.50 mg/kg given intraperitoneally 4 h before sacrifice). The mice were either normal controls or had cardiac-restricted overexpression of PP2Acα, PP1cα, or MAP4. The number inset in each micrograph gives the mean pixel intensity (white level) within the boundary of each cardiomyocyte. Scale bar, 20 μm. B, level of cardiac MAP4 protein. The MAP4 immunoblot, prepared using our anti-MAP4 antibody (24), and its loading control, prepared using an anti-GAPDH antibody (clone 6C5; Upstate Biotech), show the relative level of MAP4 protein in the myocardium from WT control mice and mice with cardiac-restricted overexpression of PP2A, PP1, or MAP4. The mean densitometric ratios for three measurements were: PP2A/control, 3.26 ± 0.05; PP1/control, 2.32 ± 0.02; and MAP4/control, 21.10 ± 0.78.
FIGURE 9.
FIGURE 9.
Intrinsic microtubule stability. These immunoblots were prepared, using our peptide antibodies to Tyr-tubulin, Glu-tubulin, and Δ2-tubulin (38), from myocardial homogenates from the same groups of mice used for Fig. 8. The increases relative to control in the post-translationally modified Glu and Δ2 α-tubulin isoforms reflect greater microtubule stability in vivo, because these modifications occur only in the microtubule-assembled αβ-tubulin heterodimers (38, 39). For this and two other sets of immunoblots, for the left set of blots, the densitometric ratio of MAP4/control signals was 1.11 ± 0.06 for Tyr-tubulin, 1.66 ± 0.05 for Glu-tubulin, and 2.64 ± 0.12 for Δ2-tubulin; for PP2A/control, it was 1.13 ± 0.08 for Tyr-tubulin, 1.77 ± 0.06 for Glu-tubulin, and 2.55 ± 0.13 for Δ2-tubulin. For the right set of blots the densitometric ratio of MAP4/control signals was 1.06 ± 0.03 for Tyr-tubulin, 1.70 ± 0.31 for Glu-tubulin, and 2.70 ± 0.51 for Δ2-tubulin; for PP1/control, it was 1.16 ± 0.14 for Tyr-tubulin, 1.58 ± 0.03 for Glu-tubulin, and 2.55 ± 0.12 for Δ2-tubulin.
FIGURE 10.
FIGURE 10.
Site-specific MAP4 dephosphorylation in mice overexpressing PP2A and PP1. A, using our antibodies (7) to MAP4 that is dephosphorylated at either Ser-924 or Ser-1056, these immunoblots were prepared from homogenates of the hearts of normal mice or mice with cardiac-restricted overexpression of either PP2A or PP1. These are the same transgenic mice that were used in Figs. 6 and 7, respectively. Equal protein loading as verified by Coomassie Blue staining was employed for each lane. B, cardiac PP2A activity is increased 1.7-fold over control in the PP2A-overexpressing mouse (22), and PP1 activity is increased 2.8-fold in the PP1-overexpressing mouse (23). Based on these data, for these two blots protein loading for PP2A and PP1 was adjusted such that the activity of each phosphatase relative to the same-blot control was the same.
FIGURE 11.
FIGURE 11.
Myocardial MARK2 quantity and activity. A, MARK2 and β-tubulin levels in control and PAB hearts. These immunoblots were prepared from myocardial homogenates from the matched RVs and LVs of cats at the indicated times after PAB using a monoclonal anti-β-tubulin antibody (clone DM-1B; Abcam), an anti-C-TAK1 antibody (catalog number 05-680; Millipore) that has equal affinity for MARK2 and MARK3 (40), and, as the loading control, a monoclonal anti-GAPDH antibody (clone 6C5; Upstate Biotech). They show that in the pressure-overloaded RVs wherein there is a persistent increase in total β-tubulin, there is a modest reduction in the level of MARK2. Because MARK2 is highly expressed in the heart (11, 41), whereas MARK3 is much more highly expressed in brain and pancreas (41), it is assumed here that the predominant protein seen in this immunoblot is MARK2. For two experiments such as that shown here, the average densitometric ratio of RV/LV total β-tubulin was 1.06 for control, 1.04 for 24-h PAB, 1.39 for 48-h PAB, 1.44 for 1-week PAB, 1.55 for 2-week PAB, and 1.91 for 4-week PAB. For MARK2, these values were 1.11 for control, 0.57 for 24-h PAB, 0.58 for 48-h PAB, 0.65 for 1-week PAB, 0.62 for 2-week PAB, and 0.74 for 4-week PAB. B, MARK2 activity in control and PAB hearts. The ratio of RV/LV activity was measured in hearts from PAB cats at the indicated times after surgery via an immunoprecipitation assay as described under “Experimental Procedures.”

Similar articles

Cited by

References

    1. Cooper G., 4th (2006) Am. J. Physiol. Heart Circ. Physiol. 291, H1003–H1014 - PubMed
    1. Kostin S., Hein S., Arnon E., Scholz D., Schaper J. (2000) Heart Fail. Rev. 5, 271–280 - PubMed
    1. Tsutsui H., Ishihara K., Cooper G., 4th (1993) Science 260, 682–687 - PubMed
    1. Cheng G., Zile M. R., Takahashi M., Baicu C. F., Bonnema D. D., Cabral F., Menick D. R., Cooper G., 4th (2008) Am. J. Physiol. Heart Circ. Physiol. 294, H2231–H2241 - PubMed
    1. Scholz D., Baicu C. F., Tuxworth W. J., Xu L., Kasiganesan H., Menick D. R., Cooper G., 4th (2008) Am. J. Physiol. Heart Circ. Physiol. 294, H1135–H1144 - PubMed

Publication types

Substances