. 2010 Oct;120(10):3493-507.
doi: 10.1172/JCI42666. Epub 2010 Sep 20.

Integration of a Notch-dependent mesenchymal gene program and Bmp2-driven cell invasiveness regulates murine cardiac valve formation

Affiliations

Integration of a Notch-dependent mesenchymal gene program and Bmp2-driven cell invasiveness regulates murine cardiac valve formation

Luis Luna-Zurita et al. J Clin Invest. 2010 Oct.

Abstract

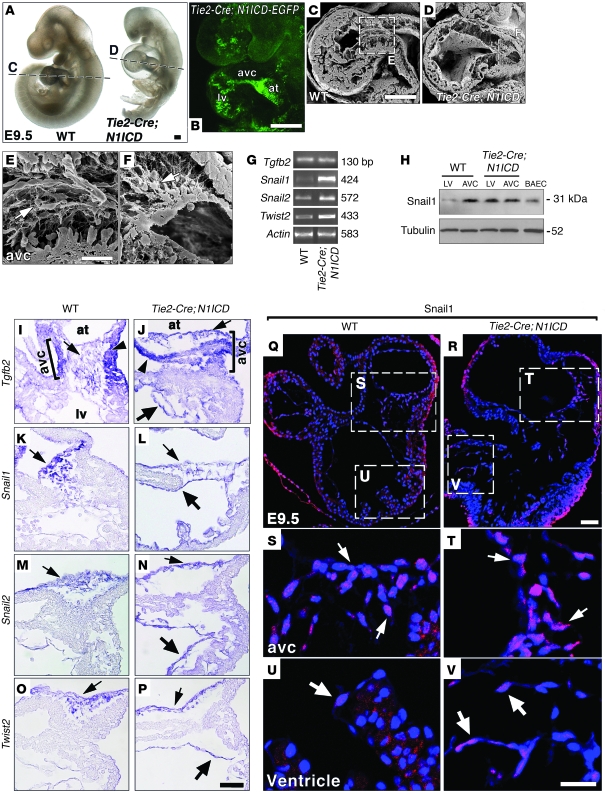
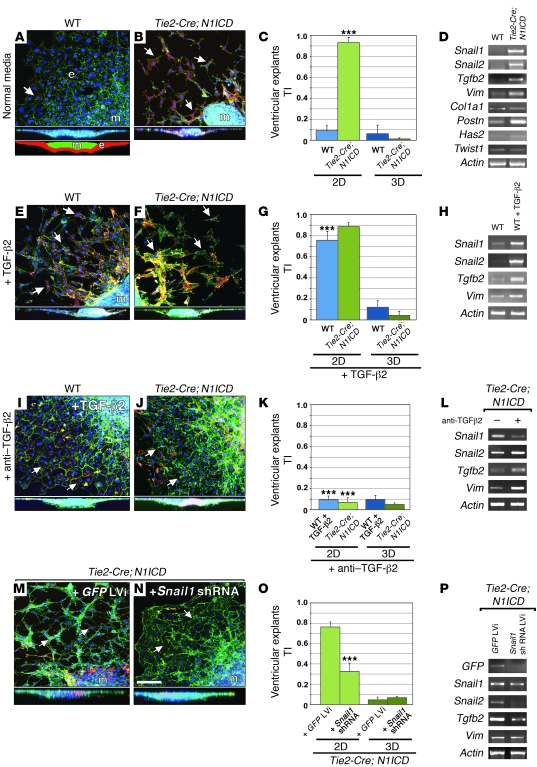
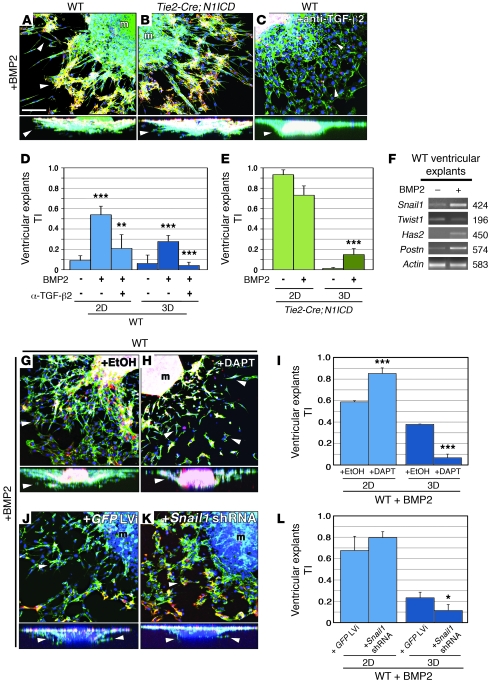
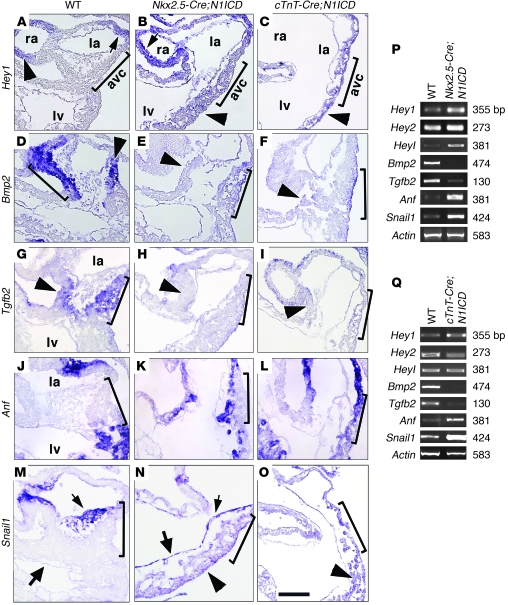
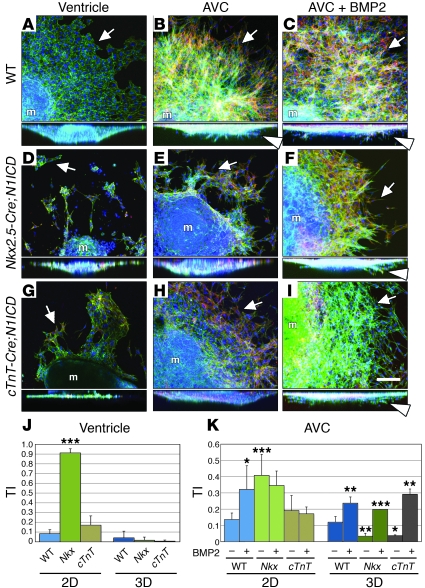
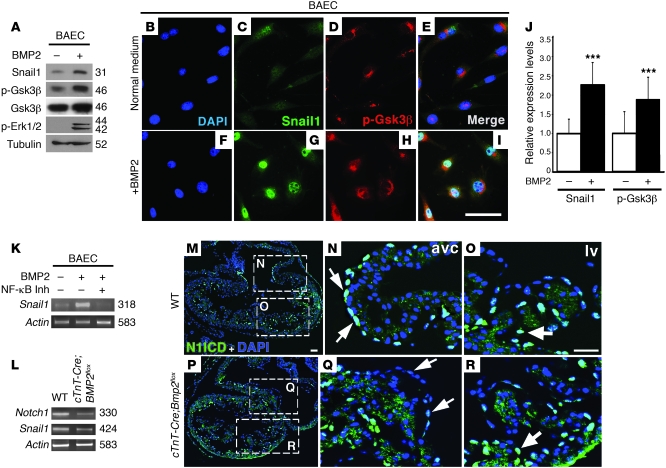
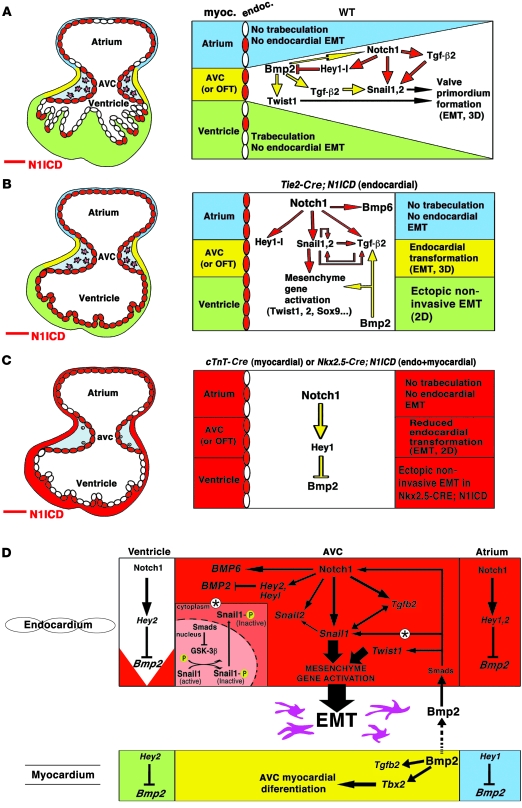
Cardiac valve formation is crucial for embryonic and adult heart function. Valve malformations constitute the most common congenital cardiac defect, but little is known about the molecular mechanisms regulating valve formation and homeostasis. Here, we show that endocardial Notch1 and myocardial Bmp2 signal integration establish a valve-forming field between 2 chamber developmental domains. Patterning occurs through the activation of endocardial epithelial-to-mesenchymal transition (EMT) exclusively in prospective valve territories. Mice with constitutive endocardial Notch1 activity ectopically express Hey1 and Heyl. They also display an activated mesenchymal gene program in ventricles and a partial (noninvasive) EMT in vitro that becomes invasive upon BMP2 treatment. Snail1, TGF-β2, or Notch1 inhibition reduces BMP2-induced ventricular transformation and invasion, whereas BMP2 treatment inhibits endothelial Gsk3β, stabilizing Snail1 and promoting invasiveness. Integration of Notch and Bmp2 signals is consistent with Notch1 signaling being attenuated after myocardial Bmp2 deletion. Notch1 activation in myocardium extends Hey1 expression to nonchamber myocardium, represses Bmp2, and impairs EMT. In contrast, Notch deletion abrogates endocardial Hey gene transcription and extends Bmp2 expression to the ventricular endocardium. This embryonic Notch1-Bmp2-Snail1 relationship may be relevant in adult valve disease, in which decreased NOTCH signaling causes valve mesenchyme cell formation, fibrosis, and calcification.


Figures

Figure 1
Figure 1. E9.5 Tie2-Cre;N1ICD mice ectopically express mesenchyme genes in chamber endocardium.
(A) WT and Tie2-Cre;N1ICD embryos. Dotted lines indicate C and D section planes. (B) Endocardial EGFP expression in a Tie2-Cre;N1ICD embryo. at, atrium. (C and D) SEM images of longitudinal WT (C) and Tie2-Cre;N1ICD (D) heart sections. (E and F) Details of AVC in WT (E) and Tie2-Cre;N1ICD hearts (F). Arrows, mesenchymal cells. (G) Semiquantitative RT-PCR analysis in hearts. (H) Snail1 Western blot. (IP) WISH, heart details. Arrowheads, AVC myocardium; thin arrows, AVC endocardium; thick arrows, ventricular endocardium. (I) Tgfb2 expression in WT AVC myocardium and endocardium (bracket). (J) Normal Tgfb2 expression in AVC and ectopic expression in ventricular endocardium of Tie2-Cre;N1ICD embryos. (K and L) WT mice express Snail1 in AVC endocardium and mesenchyme (K); Tie2-Cre;N1ICD embryos show ectopic expression in ventricular endocardium (L). Tie2-Cre;N1ICD hearts also show ectopic ventricular expression of Snail2 (N) and Twist2 (P). (QV) Snail1 expression (red) in E9.5 heart. Nuclei are DAPI counterstained (blue). (Q) General view of an E9.5 WT heart. (S) Detail of AVC region. Arrows, nuclear Snail1 in endocardial and mesenchyme cells. (U) Detail of LV region with an ENC weakly expressing Snail1 (arrow). (R) General view of Tie2-Cre;N1ICD heart. (T) Detail of AVC. Arrows, nuclear Snail1 staining in endocardium and mesenchyme. (V) Ectopic Snail1 staining in ventricular endocardium. Scale bars: 100 μm (A and B); 125 μm (C and D); 20 μm (E and F); 10 μm (IP); 30 μm (Q and R); 20 μm (SV).
Figure 2
Figure 2. Tie2-Cre;N1ICD ventricular explants undergo Tgf-β2– and Snail1-mediated ectopic EMT.
(A, E, and I) Details of WT explants. (B, F, J, M, and N) Details of Tie2-Cre;N1ICD explants. Full lateral views of explants are shown below panels AN. Schematic of a full lateral view of explant is shown at the bottom of panel A. e, endocardium (red); m, myocardium (green). All explants were stained with phalloidin-FITC (green), anti–α-SMA–Cy3 (red), and DAPI (blue). Arrows mark ENCs. (C, G, K, and O) Quantitative analysis of 2D and 3D TI. (D, H, L, and P) RT-PCR of explant endocardium. (A) WT. Arrow, ENCs growing as a monolayer. The lateral section shows ENC outgrowth on the collagen surface. (B) Tie2-Cre;N1ICD. Arrows, scattered ENCs that have undergone partial EMT. (C) 2D TI is increased in Tie2-Cre;N1ICD explants (P = 3.7 × 10⁻⁴). (D) Snail1, Snail2, Tgfb2, Vimentin, and Periostin expression is upregulated; Has2 is slightly increased and Twist1 appears unaffected. (E, F, and G) ENCs scatter without invading the collagen in TGF-β2–treated WT explants, and 2D TI is increased with respect to untreated WT ones (C; P = 1.8 × 10⁻⁷) and Tie2-Cre;N1ICD explants. (H) Increased Snail1, Snail2, and Tgfb2 expression. (I and K) ENCs of WT explants cultured with TGF-β2 and anti–TGF-β2 antibody grow as a monolayer and show reduced 2D TI with respect to TGF-β2–treated WT (G; P = 8.1 × 10⁻⁶). (J and K) Anti–TGF-β2 reduces ENC migration in Tie2-Cre;N1ICD explants, reflected in a reduced 2D TI (P = 2.3 × 10⁻⁵) and attenuated Snail1 expression (L). (MO) Lentiviral-mediated shRNA Snail1 downregulation in transgenic explants reduces ENC migration with respect to GFP-transduced control explants (P = 3.3 × 10⁻⁸). LVi, lentivirus. (P) Expression of Snail2 and Tgfb2 is reduced. Scale bar: 50 μm. Results are expressed as mean + SD. ***P < 0.001.
Figure 3
Figure 3. BMP2 induces ventricular explants to undergo Tgf-β2–, Notch-, and Snail1-mediated invasive EMT.
All explants were triple stained as in Figure 2. (AC, G, H, J, and K) Details of explants. Full lateral views are shown below. Arrowheads mark invading ENCs. (A and D) BMP2 treatment of WT ventricular explants induces invasive EMT, increasing 2D and 3D TI (P = 2 × 10⁻⁴ and 2.7 × 10⁻⁴). (B and E) BMP2 treatment increases the 3D TI of Tie2-Cre;N1ICD explants (P = 9 × 10⁻⁴) at the expense of reduced 2D TI. (C and D) Anti–TGF-β2 reduces the 2D and 3D TI of BMP2-treated WT explants (P = 4.1 × 10⁻³ and 1.8 × 10⁻⁷). (F) BMP2-treated WT ventricular explants upregulate Snail1, Has2, and Periostin, but Twist1 appears unaffected. (GI) Inhibition of Notch with DAPT reduces invasive capacity (3D TI) of BMP2-treated WT ventricular explants (P = 1.02 × 10⁻⁸), while increasing 2D TI (P = 1.3 × 10⁻⁴). (JL) Lentiviral-mediated shRNA Snail1 downregulation reduces the invasive capacity of BMP2-treated WT explants. (P = 3.4 × 10⁻²). m, myocardium. Scale bar: 50 μm. Results are expressed as mean + SD. **P < 0.01; ***P < 0.001.
Figure 4
Figure 4. Myocardial Notch1 activation leads to loss of AVC identity.
(AO) WISH of E9.5 hearts, showing detail of AVC and LV. Brackets mark the AVC. Arrowheads, myocardium; arrows, endocardium. la, left atrium; ra, right atrium. (AC) Hey1. Expression is restricted to atrial myocardium and endocardium in WT hearts, extends throughout myocardium and endocardium of Nkx2.5-Cre;N1ICD hearts (B) and throughout the myocardium of cTnT-Cre;N1ICD hearts (C). (DF) Bmp2 expression in WT AVC is markedly reduced in transgenic hearts. (GI) Tgfb2. Expression in WT AVC is reduced in transgenic hearts. (JL) Anf is restricted to WT atrium and ventricle myocardium, and is extended to AVC myocardium in transgenic hearts. (MO) Snail1 is expressed in WT AVC endocardium and mesenchyme (M) and extends throughout the myocardium and endocardium of Nkx2.5-Cre;N1ICD hearts (N) and throughout the myocardium of cTnT-Cre;N1ICD hearts (O). Scale bar: 30 μm. (P and Q) RT-PCR of E9.5 WT and Nkx2.5-Cre;N1ICD hearts (P) and cTnT-Cre;N1ICD hearts (Q).
Figure 5
Figure 5. BMP2 treatment rescues EMT in Notch1-expressing myocardium.
Heart explants triple stained as in Figure 2. (AI) Details of explants. Full lateral views are shown below. (A) WT ventricular explants show an endocardial monolayer. (B and C) WT AVC explants ± BMP2 undergo EMT. (D) In Nkx2.5-Cre;N1ICD ventricular explants, ENCs migrate across the collagen surface, but are not invasive. (E) Nkx2.5-Cre;N1ICD AVC explants produce migratory mesenchymal cells that show reduced invasion, which is rescued by BMP2 (F). (G) In cTnT-Cre;N1ICD ventricular explants, most ENCs grow as a monolayer and are noninvasive. (H) Mesenchymal cells in cTnT-Cre;N1ICD AVC explants migrate but show reduced invasion, which is rescued by BMP2 (I). Arrows, ENCs; arrowheads, invasive mesenchymal cells. (J) TI analysis of ventricular explants. Most ENCs in Nkx2.5-Cre;N1ICD explants (Nkx) migrate over the gel surface (P = 2.2 × 10⁻⁷ for 2D TI versus WT explants), whereas few cells in cTnT-Cre;N1ICD explants (abbreviated cTnT) migrate in 2D. 3D TI is very low for both genotypes. (K) TI analysis of AVC explants. BMP2 treatment of WT explants significantly increases 2D and 3D TI (P = 3.7 × 10⁻² and 6.1 × 10⁻³). Nkx2.5-Cre;N1ICD explants (Nkx) show increased 2D TI (P = 3.5 × 10⁻⁴) but a markedly reduced 3D TI compared with WT (P = 5.7 × 10⁻³). BMP2 treatment increases Nkx2.5-Cre;N1ICD 3D TI (P = 6.7 × 10⁻⁴) and slightly reduced 2D TI. BMP2 treatment sharply increases the 3D TI of cTnT-Cre;N1ICD explants (cTnT; P = 1.9 × 10⁻³). m, myocardium. Scale bar: 50 μm. Results are expressed as mean + SD. *P < 0.005; **P < 0.01; ***P < 0.001.
Figure 6
Figure 6. BMP2 inhibits Gsk3β, leading to Snail1 expression and nuclear stabilization.
Deletion of myocardial Bmp2 reduces Notch1 signaling in AVC. (A) Immunoblot of BAECs cultured ± BMP2. Weak Snail1 expression is detected in the absence of BMP2. BMP2 induces increased Snail1 levels and increases phosphorylation of Gsk3β and Erk1/2, suggesting Gsk3β inhibition. (BI) Immunostaining of BAECs cultured ± BMP2. (B and F) DAPI-counterstained nuclei. (C and G) Snail1 expression; nuclear staining in BMP2-treated cells is stronger and more punctate. (D and H) p-Gsk3β; predominant perinuclear p-Gsk3β staining is stronger after BMP2 treatment. (E and I) Merged showing DAPI, Snail1, and p-Gsk3β staining. (J) Quantification of Snail1 and p-Gsk3β protein. Expression is increased upon BMP2 treatment. (K) RT-PCR analysis of Snail1 expression in BAECs cultured ± BMP2 and ± NF-κB inhibitor. Snail1 expression is reduced in the presence of BMP2 and NF-κB inhibitor. (L) RT-PCR of E10.5 WT and cTnT-Cre;Bmp2flox hearts. Notch1 and Snail1 expression is reduced in mutant hearts. (MR) N1ICD immunostaining (green). Nuclei are DAPI counterstained (blue). (MO) E10 WT heart. (PR) cTnT-Cre;Bmp2flox heart. (M and P) General views. (N and Q) AVC detail. Arrows mark N1ICD-positive nuclei in WT AVC endocardium (N) and weakly positive nuclei in the corresponding region of the mutant (Q). (O and R) Detail of LV. Arrows mark N1ICD-positive nuclei in endocardium at the base of trabeculae in WT (O) and mutant embryos (R). Scale bars: 20 μm. Results are expressed as mean + SD. ***P < 0.001.
Figure 7
Figure 7. A model for concerted Notch1 and Bmp2 activities in CVF.
Left, schematic representations of the E9.5 heart. Right, schematics showing the different cardiac regions and developmental processes occurring within them. Green, ventricular myocardium; yellow, AVC myocardium; blue, atrial myocardium. ENCs expressing N1ICD are labeled red. Pink, invasive mesenchyme cells. Yellow arrows, myocardial signals; red arrows, endocardial signals. (A) WT embryo. AVC myocardial Bmp2 is required for Tgfb2, Notch1, Snail1, Snail2, and Twist1 expression. Endocardial Notch1 is required for Tgfb2 expression, activates Snail1 and Snail2, and represses Bmp2 in endocardium via Hey proteins. Bmp2 and Notch1 signals converge in AVC endocardium to promote complete EMT. (B) Tie2-Cre;N1ICD embryo. Ectopic N1ICD expression in endocardium (left) activates mesenchymal genes, promotes noninvasive EMT in ventricles but not in atria, and leads to loss of chamber identity. (C) cTnT-Cre;N1ICD and Nkx2.5-Cre;N1ICD embryos. Ectopic N1ICD expression in myocardium leads to ectopic Hey1 expression and Bmp2 repression. Myocardial AVC identity is lost, and EMT is severely affected. (D) Molecular pathways downstream of Notch during cardiac EMT. LOF and GOF data (this report and refs. , , and 43) indicate that Notch represses Bmp2 via Hey target activation. Endocardial Notch1 activates a mesenchyme gene program. The double-headed arrow linking Tgfb2 and Snail1 indicates the interdependence of both genes. Myocardial Bmp2 converges with endocardial Notch1 signaling to promote mesenchyme gene activation and EMT in the AVC. Convergence of Notch1 and Bmp2 is reflected in Notch activation of Snail1 expression and Bmp2-mediated Snail1 nuclear stabilization, via Gsk3β inhibition (*).

References

    1. Loffredo CA. Epidemiology of cardiovascular malformations: prevalence and risk factors. Am J Med Genet. 2000;97(4):319–325. doi: 10.1002/1096-8628(200024)97:4<319::AID-AJMG1283>3.0.CO;2-E. - DOI - PubMed
    1. Siu SC, Silversides CK. Bicuspid aortic valve disease. J Am Coll Cardiol. 2010;55(25):2789–2800. doi: 10.1016/j.jacc.2009.12.068. - DOI - PubMed
    1. Joziasse IC, et al. Genes in congenital heart disease: atrioventricular valve formation. Basic Res Cardiol. 2008;103(3):216–227. doi: 10.1007/s00395-008-0713-4. - DOI - PubMed
    1. Garg V, et al. Mutations in NOTCH1 cause aortic valve disease. Nature. 2005;437(7056):270–274. doi: 10.1038/nature03940. - DOI - PubMed
    1. Person AD, Klewer SE, Runyan RB. Cell biology of cardiac cushion development. Int Rev Cytol. 2005;243:287–335. doi: 10.1016/S0074-7696(05)43005-3. - DOI - PubMed

Publication types

MeSH terms