. 2010 Nov;13(11):1428-32.
doi: 10.1038/nn.2641. Epub 2010 Oct 3.

Categorical speech representation in human superior temporal gyrus

Affiliations

Categorical speech representation in human superior temporal gyrus

Edward F Chang et al. Nat Neurosci. 2010 Nov.

Abstract

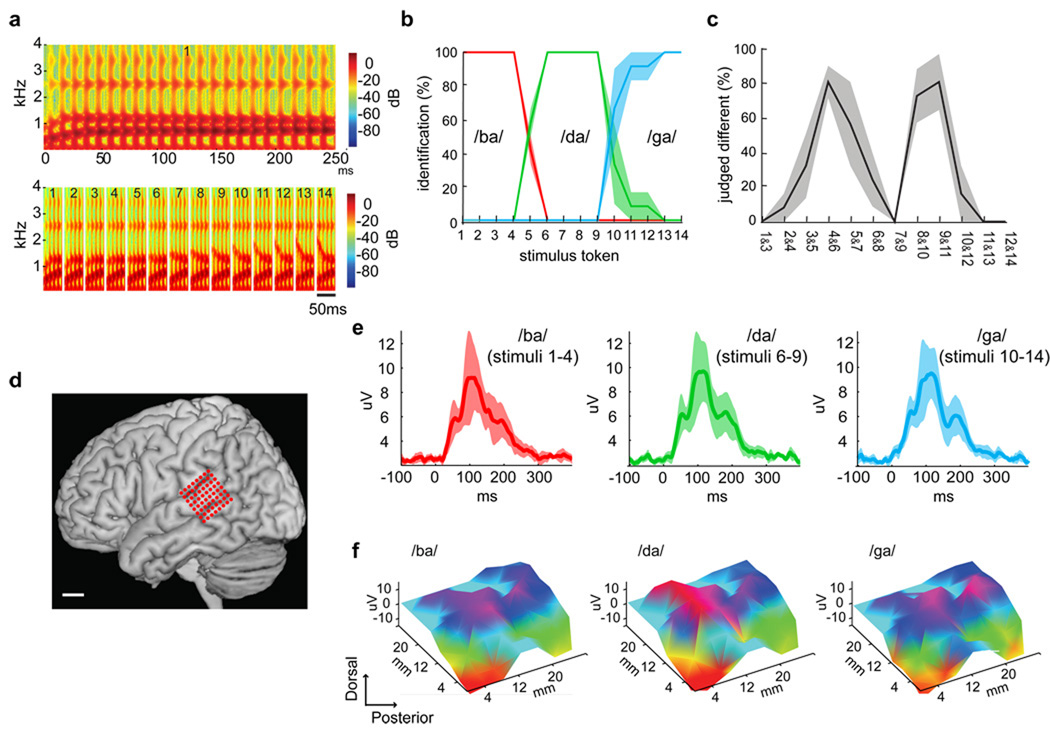
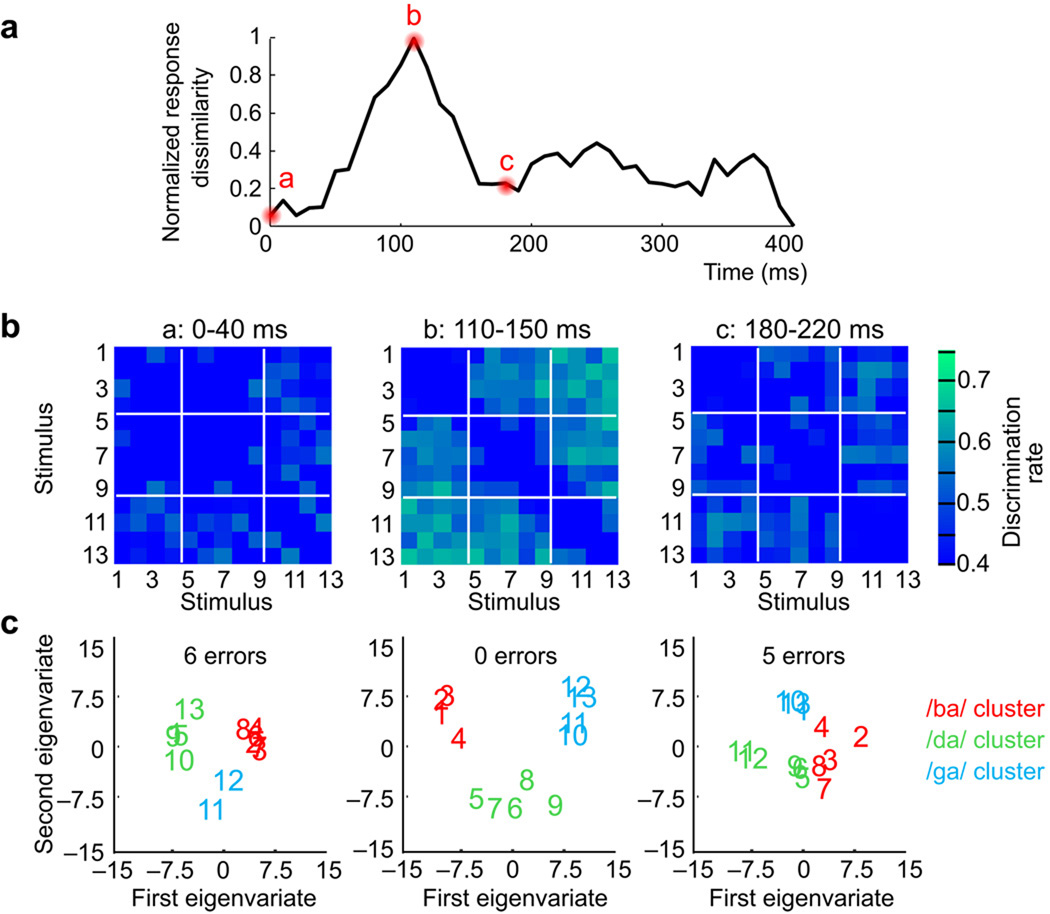
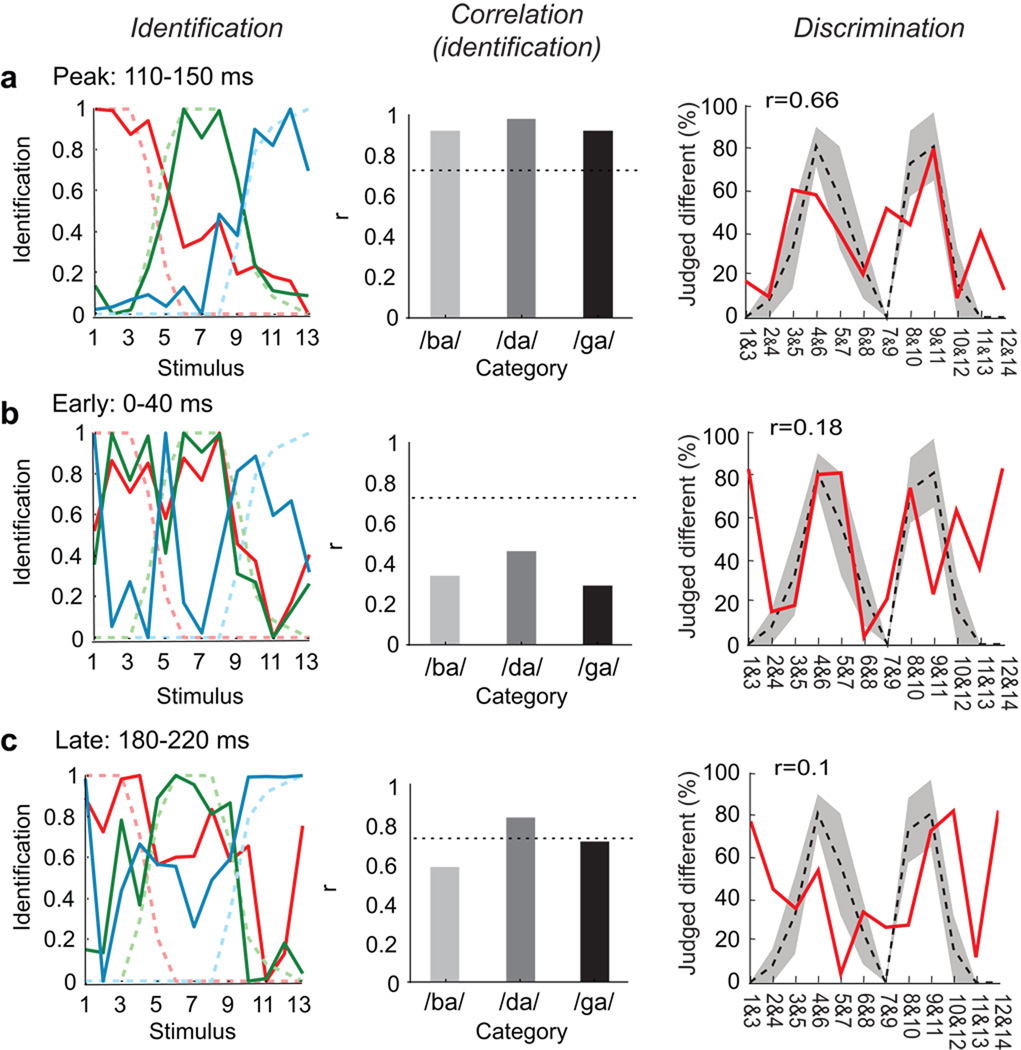
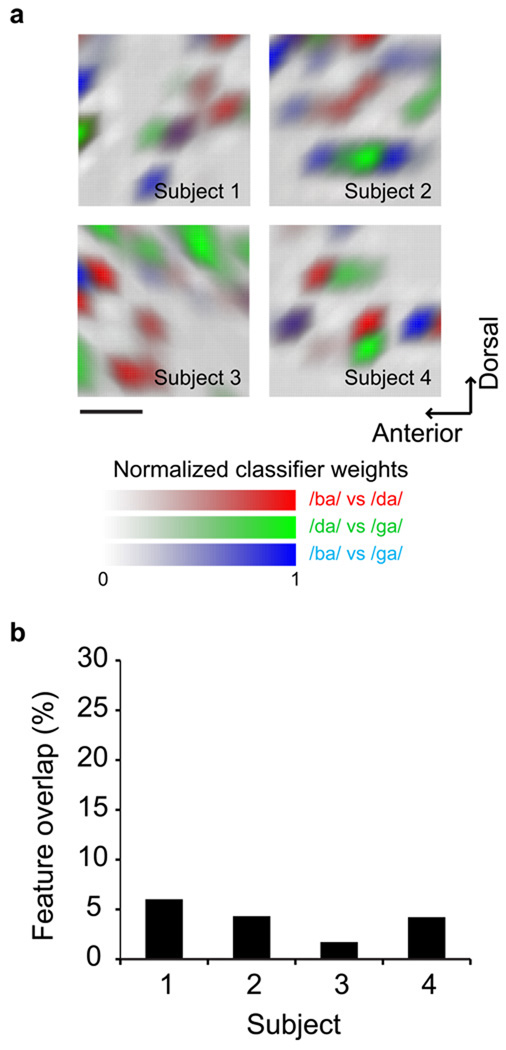
Speech perception requires the rapid and effortless extraction of meaningful phonetic information from a highly variable acoustic signal. A powerful example of this phenomenon is categorical speech perception, in which a continuum of acoustically varying sounds is transformed into perceptually distinct phoneme categories. We found that the neural representation of speech sounds is categorically organized in the human posterior superior temporal gyrus. Using intracranial high-density cortical surface arrays, we found that listening to synthesized speech stimuli varying in small and acoustically equal steps evoked distinct and invariant cortical population response patterns that were organized by their sensitivities to critical acoustic features. Phonetic category boundaries were similar between neurometric and psychometric functions. Although speech-sound responses were distributed, spatially discrete cortical loci were found to underlie specific phonetic discrimination. Our results provide direct evidence for acoustic-to-higher order phonetic level encoding of speech sounds in human language receptive cortex.


Figures

Figure 1
Figure 1. Psychophysics of categorical speech perception and speech-evoked responses during intraoperative human cortical recordings
A. Wide-band spectrograms of the stimulus token continuum, synthesized with equal parametric changes in the F2 starting frequency (from 800 to 2100Hz). Top shows the full spectrogram of a single token with an 800 Hz starting frequency (Stimulus #1, duration=250ms). Bottom shows the first 50 ms for each of the 14 stimulus tokens. B. Psychometric identification function with percentage reporting /ba/, /da/, or /ga/. C. Psychometric discrimination function (two-step). Percentage of responses judged as “different” versus “same”. The category boundaries located at peak discrimination are at stimuli 4 & 5, and 9 & 10. D. Three-dimensional surface reconstruction of representative brain MRI with superimposed electrode positions over pSTG. E. Grand average rooted mean square (RMS) evoked potentials (EP) recorded over pSTG for sound stimuli reliably categorized as /ba/ (tokens 1–4), /da/ (tokens 6–9), and /ga/ (tokens 10–14). Average EP (root mean square (RMS); solid line) and standard error of EP amplitudes (shaded). Potentials peak at approximately 110 ms after stimulus onset. F. Topographic plots of EPs at 110 ms for each prototype sound stimulus revealed distributed cortical activation pattern, with some sharply localized differences between stimuli. (uV=microvolts, ms=milliseconds, mm=millimeters).
Figure 2
Figure 2. Categorical organization of neural response patterns to a speech-stimulus continuum
A. Rapid and transient neural representation for speech stimulus discriminability. Time-series of the total normalized neural pattern dissimilarity derived from classifier performance aggregated across all pair-wise stimulus comparisons. Peak dissimilarity occurs at the same time as peak of evoked potential magnitude in Figure 1e. B. Structured neural dissimilarity. Neural confusion matrices for three time intervals at 0–40ms (a), 110–150ms (b), and 180–220ms (c) (group average data). Colorbar scaling corresponds to the classifier performance for each pairwise stimulus comparison shown in individual matrix pixels. In the 110–150ms interval, responses to some stimulus pairs, for example, 1 vs 4, 8 vs 5, or 10 vs 13, are nearly indiscriminable while other stimulus pairs elicited responses that were much easier to discriminate, for example 7 vs 11, or 3 vs 9. C. Relational organization of neural pattern response dissimilarity using multidimensional scaling. Neural pattern dissimilarity is proportional to the Euclidean distance (i.e. similar response patterns are grouped closely together, whereas dissimilar patterns are positioned far apart). K-means clustering results for group membership denoted by stimulus coloring (red=/ba/ sounds; green=/da/ sounds; blue=/ga/ sounds; k=3). Zero cluster errors were found at time interval 110–150 ms (i.e. same clustering as in psychophysical results), but 6 errors at 0–40ms, and 5 errors at 180–220 ms.
Figure 3
Figure 3. Correlation of neurometric and psychometric category boundaries
Peak encoding at 110–150ms. A. Left, Comparison of neuronal (dark) and psychophysical (light/dashed) -derived identification functions. Neurometric identification functions were determined by using the MDS distance between each stimulus position and the three cluster means. Middle, Correlation between neurometric and psychometric identification functions (Pearson’s correlation, 0.92 for /ba/, 0.98 for /da/, and 0.92 for the /ga/ category; dotted line: threshold of corrected p-value at 0.05. Right, Comparison of neural (red) and psychophysical (black/dashed) discrimination functions. The neurometric discrimination functions were derived from the distance of the stimulus responses in MDS space. At 110 ms both the position of the maxima and the general shape of the neurometric function correlate well with the psychometric function. (r=0.66, p<0.05). Early (0–40ms, B) and late (180–220ms, C) epoch field potentials demonstrate poor correlation between neural and psychophysical results (see insets).
Figure 4
Figure 4. Topography of discriminative cortical sites in the pSTG underlying categorical speech perception
A. The degree of separability of the various evoked activations at each electrode position is shown as classifier weights. The spatial patterns indicate that discriminative neuronal activation is not distributed over the pSTG but instead concentrated in few cortical sites. B. The informative loci overlap very little between comparisons of the features (on average 3.9 +/−0.88%), (indicated by mixed colors such as magenta, cyan, or orange in panel A) suggesting that the neuronal categorization is not accomplished by simply scaling the responses in the same network but rather is a function of spatially discrete and local selectivity.

Comment in

  • Categorizing speech.
    Scott SK, Evans S. Scott SK, et al. Nat Neurosci. 2010 Nov;13(11):1304-6. doi: 10.1038/nn1110-1304. Nat Neurosci. 2010. PMID: 20975749 No abstract available.

References

    1. Perkell J, Klatt DH, editors. Invariance and variability in speech processes. Hillsdale, NJ: Lawrence Erlbaum Associates; 1986.
    1. Liberman AM, Cooper FS, Shankweiler DP, Studdert-Kennedy M. Perception of the speech code. Psychol Rev. 1967;74:431–461. - PubMed
    1. Diehl RL, Lotto AJ, Holt LL. Speech perception. Annu Rev Psychol. 2004;55:149–179. - PubMed
    1. Liberman AM, Mattingly IG. A specialization for speech perception. Science. 1989;243:489–494. - PubMed
    1. Vihman M. Phonological Development: The Origins of Language in the Child. Cambridge: Wiley-Blackwell; 1996.

Publication types

MeSH terms