. 2010 Nov;13(11):1433-40.
doi: 10.1038/nn.2648. Epub 2010 Oct 3.

Functional imaging of hippocampal place cells at cellular resolution during virtual navigation

Affiliations

Functional imaging of hippocampal place cells at cellular resolution during virtual navigation

Daniel A Dombeck et al. Nat Neurosci. 2010 Nov.

Abstract

Spatial navigation is often used as a behavioral task in studies of the neuronal circuits that underlie cognition, learning and memory in rodents. The combination of in vivo microscopy with genetically encoded indicators has provided an important new tool for studying neuronal circuits, but has been technically difficult to apply during navigation. Here we describe methods for imaging the activity of neurons in the CA1 region of the hippocampus with subcellular resolution in behaving mice. Neurons that expressed the genetically encoded calcium indicator GCaMP3 were imaged through a chronic hippocampal window. Head-restrained mice performed spatial behaviors in a setup combining a virtual reality system and a custom-built two-photon microscope. We optically identified populations of place cells and determined the correlation between the location of their place fields in the virtual environment and their anatomical location in the local circuit. The combination of virtual reality and high-resolution functional imaging should allow a new generation of studies to investigate neuronal circuit dynamics during behavior.


Figures

Figure 1
Figure 1
Experimental setup. a. The experimental apparatus consisting of a spherical treadmill, a virtual reality apparatus (projector, RM: reflecting mirror, AAM: angular amplification mirror, toroidal screen and a optical computer mouse to record ball rotation) and a custom two-photon microscope (Ti:S: titanium:sapphire laser, LP: long pass filter, X-Y: galvanometers, SL: scan lens, M: mirror, TL: tube lens, DM: dichroic mirror, CL: collection lens, L: biconcave lens, BP: bandpass filter, FL: focusing lens, PMT: photomultiplier tube, Sliding stage: used to move microscope for treadmill access, X-Y translation: moves treadmill and mouse, Z-translation: objective focus control, Rubber tube (shown in cross-section): for light shielding). b. Photograph of experimental setup. c. View from one end of the virtual linear track (top). Top view of the linear track (bottom). d. View of materials used to block background light from entering the microscope objective hole. Hippocampal imaging window can also be seen. e. Detailed view of hippocampal imaging window (from boxed region in d.) f. In vivo two-photon images at different depths through the hippocampal window.
Figure 2
Figure 2
Imaging CA1 place cells in the dorsal hippocampus. a. Two-photon image of neuron cell bodies in stratum pyramidale of CA1 labeled with GCaMP3. The indicator is excluded from the nucleus. ROIs for example cells are shown in red (right). b. GCaMP3 baseline subtracted ΔF/F traces are shown in black for a subset of the cells labeled in a (right). Red traces indicate significant calcium transients with <5% false positive error rates (see Methods). The position of the mouse along the virtual linear track and reward times are shown at the bottom. c. Expanded view of boxed region in (b). d. Mean ΔF/F versus linear track position for a subset of the cells labeled in a (right). e. A plot of mean ΔF/F versus linear track position for all of the cells labeled in a (right). f. Place cells are colored according to the location of their place fields along the virtual linear track. Only place cells with significant place fields during running in the positive direction are shown here.
Figure 3
Figure 3
Place cells differ depending on the running direction in the linear track. a. An example imaging field in which the place cells are colored according to the location of their place fields along the virtual linear track. Significant place fields during running in the positive direction are shown on the left and negative running direction are shown on the right. Example place cells with different place fields or no place fields depending on the running direction are highlighted with closed arrowheads or open arrowheads, respectively. b. A plot of mean ΔF/F versus linear track position for the positive direction place cells labeled in a (left) during running in the positive (left) and negative (right) directions. c. Histogram of directionality index for all place fields.
Figure 4
Figure 4
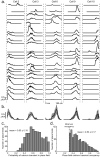
Characterization of place cell calcium transients and place fields. Histograms of place cell transient widths (a) and transient peak ΔF/F (b) are shown for periods of mouse movement along the virtual track. Histograms of place field position along the linear track (c) and place field widths (d) are also shown.
Figure 5
Figure 5
Place cell activity variability in place fields. a. Temporal activity pattern versus virtual linear track position traces for a subset of the cells shown in Fig. 2 a (right). Each of the 21 positive running direction track traversals is shown for each of the cells. b. Mean and SD of ΔF/F versus linear track position for the traces shown in (a). Histograms of the probability that a place cell is active during traversals through the place field (c) and of the percentage of place field traversal time that the cell had a significant calcium transient (d).
Figure 6
Figure 6
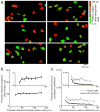
Spatial organization of place cells in dorsal CA1. a. Example images from different fields of view in which the place cells are colored according to the location of their place fields along the virtual linear track. Each image shows place cells with significant place fields during running in either the positive or negative direction. b. Plot of mean place field-place field distance versus mean place cell-place cell distance averaged over all 47 time-series. The error bars represent SE. c. Plot of mean cell-cell temporal activity pattern correlation versus mean cell-cell distance averaged over all 47 time-series for all place cells (grey) and all neurons (black). The error bars represent SE.
Figure 7
Figure 7
Imaging place related activity in dendrites and putative interneurons. a,b. A two-photon image (b) of a field of view ∼75 microns ventral to the stratum pyramidale cell body layer (dashed line in a). Bright spots in (b) are a cross-section through the apical dendrites from the overlying CA1 neurons. c. Mean ΔF/F versus linear track position for the dendrites labeled in the image in (b). d,e. A two-photon image (e) of a field of view ∼50 microns dorsal to the stratum pyramidale cell body layer (dashed line in d). Sparsely distributed cell bodies in (e) are assumed interneurons. f. Mean ΔF/F versus linear track position for the interneurons labeled in the image in (e).

Comment in

  • Neuroscience in a virtual world.
    Pastrana E. Pastrana E. Nat Methods. 2010 Dec;7(12):948-9. doi: 10.1038/nmeth1210-948a. Nat Methods. 2010. PMID: 21158013 No abstract available.

References

    1. O'Keefe J, Dostrovsky J. The hippocampus as a spatial map. Preliminary evidence from unit activity in the freely-moving rat. Brain Res. 1971;34:171–175. - PubMed
    1. Ergorul C, Eichenbaum H. The hippocampus and memory for “what,” “where,” and “when”. Learn Mem. 2004;11:397–405. - PMC - PubMed
    1. O'Keefe J. Hippocampal Neurophysiology in the Behaving Animal. In: Andersen P, editor. The hippocampus book. Oxford University Press; Oxford; New York: 2007. pp. 475–548.
    1. Leutgeb S, Leutgeb JK, Moser MB, Moser EI. Place cells, spatial maps and the population code for memory. Curr Opin Neurobiol. 2005;15:738–746. - PubMed
    1. Nakamura NH, et al. Hippocampal cells encode places by forming small anatomical clusters. Neuroscience. 2010;166:994–1007. - PMC - PubMed

Publication types

MeSH terms