Comparative Study
. 2010 Dec 15;432(3):585-94.
doi: 10.1042/BJ20100878.

The immunoproteasome, the 20S proteasome and the PA28αβ proteasome regulator are oxidative-stress-adaptive proteolytic complexes

Affiliations
Comparative Study

The immunoproteasome, the 20S proteasome and the PA28αβ proteasome regulator are oxidative-stress-adaptive proteolytic complexes

Andrew M Pickering et al. Biochem J. .

Abstract

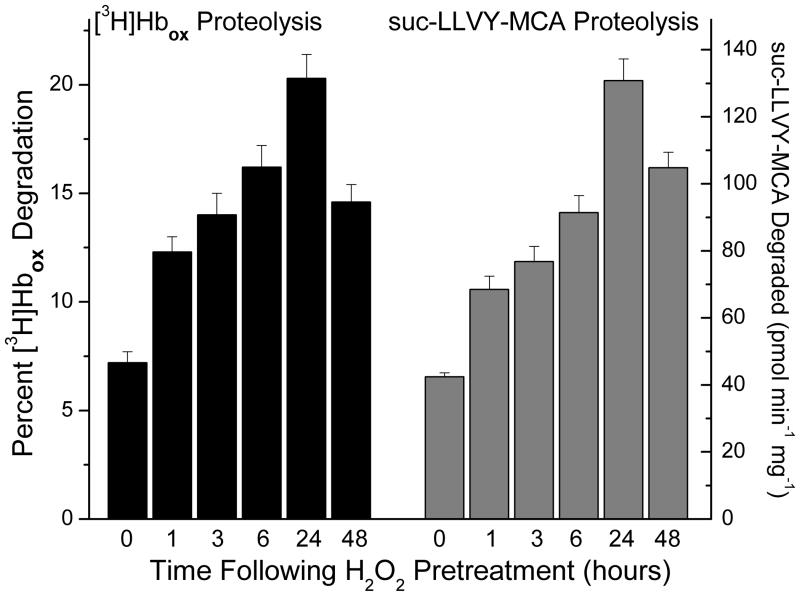
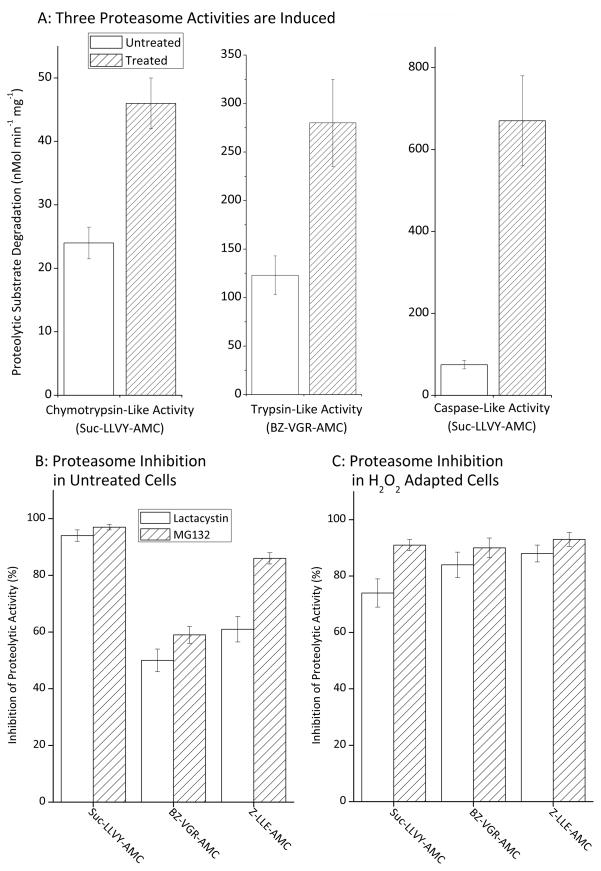
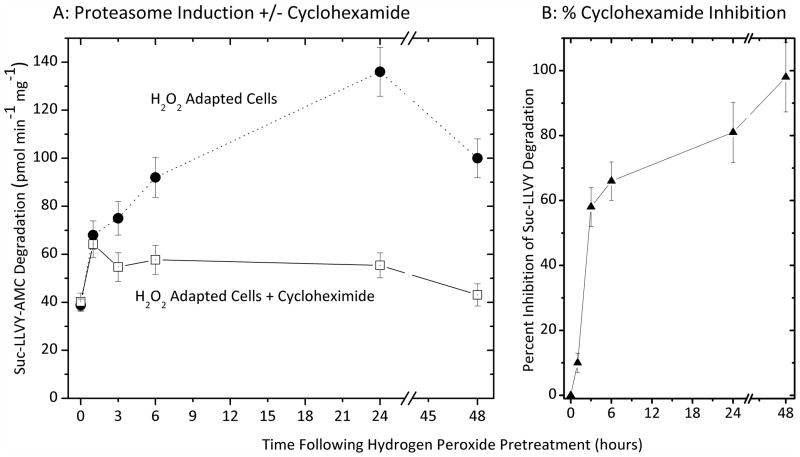
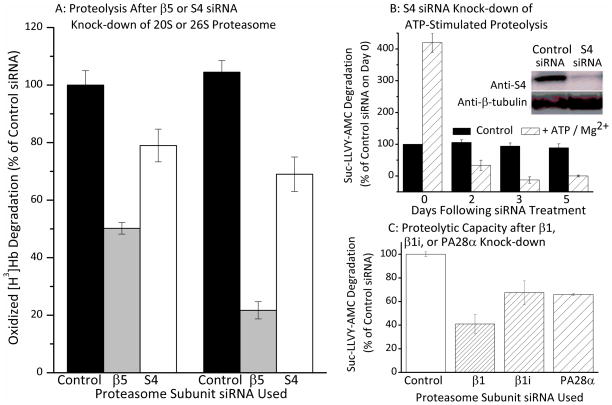
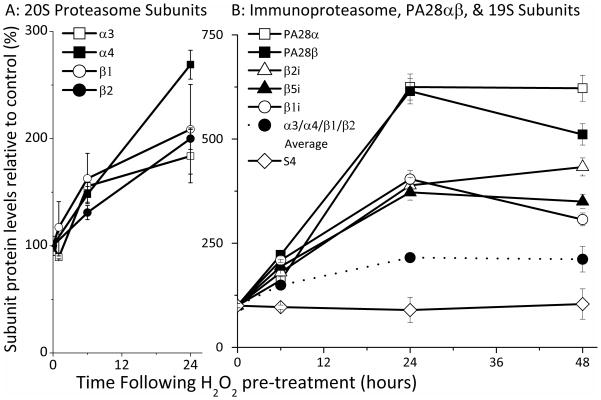
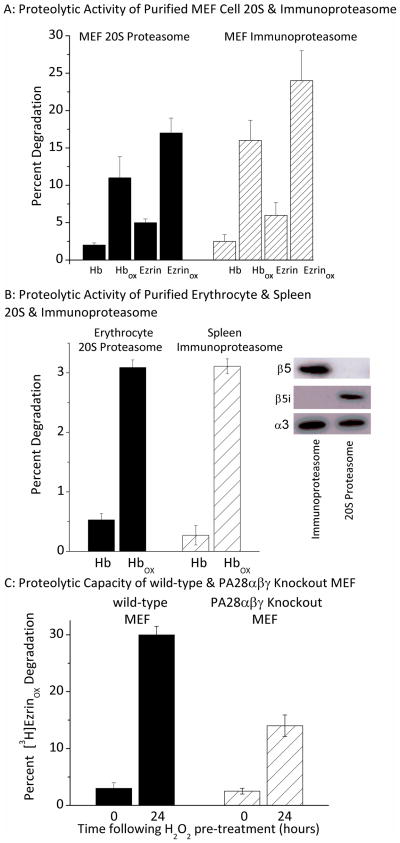
Oxidized cytoplasmic and nuclear proteins are normally degraded by the proteasome, but accumulate with age and disease. We demonstrate the importance of various forms of the proteasome during transient (reversible) adaptation (hormesis), to oxidative stress in murine embryonic fibroblasts. Adaptation was achieved by 'pre-treatment' with very low concentrations of H2O2, and tested by measuring inducible resistance to a subsequent much higher 'challenge' dose of H2O2. Following an initial direct physical activation of pre-existing proteasomes, the 20S proteasome, immunoproteasome and PA28αβ regulator all exhibited substantially increased de novo synthesis during adaptation over 24 h. Cellular capacity to degrade oxidatively damaged proteins increased with 20S proteasome, immunoproteasome and PA28αβ synthesis, and was mostly blocked by the 20S proteasome, immunoproteasome and PA28 siRNA (short interfering RNA) knockdown treatments. Additionally, PA28αβ-knockout mutants achieved only half of the H2O2-induced adaptive increase in proteolytic capacity of wild-type controls. Direct comparison of purified 20S proteasome and immunoproteasome demonstrated that the immunoproteasome can selectively degrade oxidized proteins. Cell proliferation and DNA replication both decreased, and oxidized proteins accumulated, during high H2O2 challenge, but prior H2O2 adaptation was protective. Importantly, siRNA knockdown of the 20S proteasome, immunoproteasome or PA28αβ regulator blocked 50-100% of these adaptive increases in cell division and DNA replication, and immunoproteasome knockdown largely abolished protection against protein oxidation.


Figures

Figure 1
Figure 1. Proteolytic Capacity Increases During Transient Adaptation to H2O2
MEF cells were grown to 50% confluence and exposed, in PBS, to an adaptive pre-treatment of 2 μmol H202 per 107 cells. Successful transient adaptation (peaking at about 24 hours and then declining) was confirmed by increased capacity to survive a subsequent (much higher) challenge dose of H2O2 that, without adaptation, significantly decreased cell proliferation and DNA replication, and significantly increased accumulation of oxidized proteins (confirmatory data not shown at this point, but given as part of Figure. 7) as previously described [25, 26]. At various time points after exposure, cells were harvested and lysed then suspended in 50mM Tris, 25mM KCl, 10mM NaCl, 1mM MgCl2, (pH 7.5). Proteolytic activity assays for degradation of either [3H]Hbox [5, 15] or suc-LLVY-AMC [48, 49] were performed as described in Materials & Methods. Values are means ± SE, n = 3. The experiment was repeated in MEF cells grown to only 20% confluence and adapted by pre-treatment with 250 nmol of H202 per 107 cells, with very similar results (data not shown.)
Figure 2
Figure 2. Proteasome Capacity is Increased During Transient Adaptation to H2O2
Panel A. MEF cells were grown to 20% confluence then transiently adapted to oxidative stress by pre-treatment with 250 nmol of H202 per 107 cells in complete media and incubated at 37ºC under 5% CO2. After one hour, the cells were washed twice with PBS and fresh complete media added. Twenty four hours after exposure, the cells were harvested. Cells were then lysed and suspended in 50mM Tris, 25mM KCl, 10mM NaCl, 1mM MgCl2 (pH 7.5). Proteolytic activity assays for degradation of suc-LLVY-AMC, Bz-VGR-AMC, and Z-LLE-AMC were then performed, as described in Materials & Methods. Values are means ± SE, n = 6. Panel B. MEF cells were prepared, harvested and lysed as described in figure 2A but not pre-treated with H2O2. Samples were then incubated with 1 μM of either MG312 or lactacystin for 30 minutes after which proteolytic activity assays for degradation of suc-LLVY-AMC, Bz-VGR-AMC, and Z-LLE-AMC were performed. Values (means ± SE, n = 3) represent the percent reduction in proteolytic activity following treatment with inhibitors. Panel C. MEF cells were prepared, transiently adapted to oxidative stress by pre-treatment with 250 nmol of H2O2 per 107 cells (as per Panel A), harvested and lysed. Samples were then incubated with 1 μM MG312 or lactacystin for 30 minutes, and proteolytic activity assays for suc-LLVY-AMC, Bz-VGR-AMC, and Z-LLE-AMC were performed. Values (means ± SE, n = 3) are the percent reduction in proteolytic activities caused by treatment with proteolytic inhibitors.
Figure 3
Figure 3. Inhibition of Proteasome induction by cyclohexamide
Panel A. MEF cells were incubated with 100 μg/ml of cyclohexamide (or not treated) in an attempt to block H2O2 induced expression of proteolytic enzymes. Cells were then grown to 50% confluence and exposed (in PBS) to a transient adaptive pre-treatment 2 μmol of H202 per 107 cells, harvested, and lysed, as described in the legend to Figure. 1. Proteolytic activity assays for degradation of suc-LLVY-AMC were then performed, as per Figs. 1 and 2. Panel B. Inhibition of proteasome induction plotted as the percent inhibition (means ± SE, n = 3) exerted by cycloheximide against the H2O2 induced (adaptive) proteasome activity of panel A.
Figure 4
Figure 4. ATP-Independent Degradation of Oxidized Proteins by the Proteasome
Panel A. MEF cells were grown to 50% confluence and treated with β5, S4 or control (scrambled) siRNA. Cells were grown for a further 5 days then harvested, lysed, and suspended in 50mM Tris, 25mM KCl, 10mM NaCl, 1mM MgCl2 at (pH 7.5). Proteolytic activity assays for degradation of [3H]Hbox were performed as in Fig. 1 [15, 48, 49], on control samples and samples for which cells were grown for a period of 2 or 5 days following siRNA treatment, Values are means ± SE, n = 3. Panel B. The inset shows a Western blot for S4 knock-down. Quantification of triplicate blots, in comparison with standards, revealed an average 90% decrease in S4 subunit content relative to control siRNA treatments. The main portion of Panel B shows a comparison of ATP-stimulated and ATP-independent proteasomal chymotrypsin-like activity over a 5-day S4 siRNA knock-down time course. Cells were prepared as described in panel A and treated with either S4 or control (scrambled) siRNA. Cells were grown for a further 1 to 5 days and were then harvested, lysed, and suspended in 50mM Tris, 25mM KCl, 10mM NaCl, 1mM MgCl2 at (pH 7.5). Proteolytic activity assays for ATP-stimulated degradation of suc-LLVY-AMC, were then performed in the presence and absence of 10mM ATP. Addition of ATP produced a 4.2-fold increase in proteolysis in control samples (not treated with siRNA), or treated with control (scrambled) siRNA, on Day 0. By Day 2 of S4 siRNA treatment, however, ATP stimulation of proteolysis was only 10% of control values, and by Day 5, ATP completely failed to stimulate degradation (all data are means ± SE, n = 4). Panel C. MEF cells were grown to 20% confluence and then treated with control (scrambled) siRNA, or with siRNA’s directed against β1, β1i (Lmp2), PA28α. ATP-independent proteasomal chymotrypsin-like activity (capacity to degrade suc-LLVY-AMC) was then measured in all samples as described in Panel B. Values are means ± SE, n = 4.
Figure 5
Figure 5. Expression of 20S Proteasome, 26S Proteasome, Immunoproteasome, and PA28αβ Regulator Subunits During Adaptation to H2O2
Panel A. MEF cells were grown to 50% confluence and exposed (in PBS) to a transient adaptive pre-treatment of 2 μmol of H202 per 107 cells, then harvested as described in the legend to Figure. 1. Cells were then lysed and analyzed by Western blot, using antibodies against the 20S proteasome subunits β1, β2, α3 and α4. An enhanced chemiluminescence kit, (Pierce: Rockford, IL), was used for detection and membranes were developed onto Kodak Biomax films (VWR: West Chester, PA) using the Kodak GBX developing system. 20S proteasome subunit levels were quantified in comparison with standards. Panel B. MEF cells were prepared, H2O2 pre-treated (adapted), harvested, lysed and analyzed by Western blot, as described in Panel A. For Panel B, however, gels were probed with antibodies raised against the Immunoproteasome subunits β1i (Lmp2), β2i (Mecl-1), β5i (Lmp7) and S4 (26S proteasome subunit). An enhanced chemiluminescence kit (Pierce: Rockford, IL), was again used for detection, but signals were detected, and quantified in comparison with standards, using the biospectrum imaging system (UVP: Upland, CA). Also shown in Panel B, as a dotted line between solid circle symbols, is the arithmetic mean of 20S proteasome α3, α4, β1, and β2 subunit level values taken from Panel A. In both panels, values for percent change in subunit levels are means ± SE, n = 4, are reported as percent of control (non H2O2 adapted) levels.
Figure 6
Figure 6. Importance of the Immunoproteasome and Pa28 for the Degradation of Oxidized Proteins
Panel A. Proteolytic Activity of Purified MEF Cell 20S & Immunoproteasome. 20S proteasome was isolated from MEF cells and immunoproteasome was isolated after 2 days of cell treatment with IFNγ, as described by Tanakaa et al. [36, 37]. Purified 20S proteasome or purified immunoproteasome was then incubated for 60 minutes with [3H]Hb, [3H]ezrin, [3H]Hbox, or [3H]ezrinox. The percent protein substrate degraded was calculated, after addition of 20% trichloroacetic acid and 3% BSA to precipitate remaining intact proteins[5, 12, 15]. Percent protein degraded was determined by release of acid soluble counts in TCA supernatants using liquid scintilation in which % Degradation = (acid-soluble counts – background counts) x 100. Values are means ± SE, n = 3. Panel B: Proteolytic Activity of Purified Erythrocyte & Spleen 20S & Immunoproteasome. 20S proteasome purified from human erythrocytes, and Immunoproteasome purified from human spleen were studied exactly as per Panel A. Values are means ± SE, n = 3. The inset shows 20S proteasome and immunoproteasome samples of equal quantity, screened by Western blot with antibodies directed against β5, β5i (Lmp7) or α3 subunits, and demonstrates the purity of the 20S and immunoproteasome preparations. Panel C: Proteolytic Capacity of Wild-type & PA28αβγ Knockout MEF. Wild type MEF and PA28αβγ knockout cells developed by Yamano et al. [35] were transiently adapted to oxidative stress by pre-treatment with 4 μmol H2O2 per 107 cells. Control (0hr) and 24hr H2O2 adapted wild-type MEF and PA28αβγ knockout MEF cells were then harvested and lysed as described in the legend to Figure. 1. Lysates were then incubated for 60 minutes with [3H]ezrinox. Percent [3H]ezrinox protein degraded was determined as per Panel A. Values are means ± SE, n = 3.
Figure 7
Figure 7. Blocking the Induction of 20S Proteasome, Immunoproteasome or PA28αβ Inhibits Adaptation in H2O2 Challenged Cells
Panel A. MEF cells were grown to 20% confluence and then treated with β1, β1i (Lmp2), PA28α or control (scrambled) siRNA for 24 hours to block induction of the relevant proteasome subunits (see Supplemental Fig. 1 for proof of siRNA effectiveness). After siRNA exposure the media was replaced with fresh complete medium and after a further 24 hours (a total of 48 hours after initial siRNA exposure), some cells were transiently adapted to oxidative stress by pre-treatment with 2 μmol of H2O2 per 107 cells, while others were not adapted. Cells were incubated at 37ºC under 5% CO2 for 1 hour, after which the medium was replaced. Following a 24 hour adaptation period, both adapted and non-adapted cells were challenged by incubation with a high dose of 1 mM H2O2 (≈25 μmol H2O2 per 107 cells). Cells were then harvested and reseeded at 100,000 cells per ml on 96 well plates and the BrdU assay was then performed (as per Materials & Methods). BrdU results (means ± SE, n = 3) represent cellular BrdU incorporation into DNA in arbitrary units. On the X-axis, “No Pre-treatment” represents samples that were treated with control (scrambled) siRNA and challenged with high H2O2, but were not adapted by pre-treatment with low H2O2. All other samples were first treated with siRNA’s, adapted by pre-treatment with low H2O2, and then challenged by exposure to high (1.0mM) H2O2. Panel B. MEF cells were prepared, treated with siRNA’s, transiently adapted to oxidative stress 7 by pre-treatment with H2O2 (or not pre-treated), challenged with 1 mM H2O2 (≈25 μmol H2O2 per 107 cells), and harvested, exactly as described in Panel A. Samples were then seeded at a density of 100,000 cells per ml in 24 well plates. Cells were incubated for a further 24 hours, then cell counts were taken using a cell counter (see Materials & Methods). Values (means ± SE, n = 3) represent the cell proliferation in challenged cells which previously were either pre-treated with an adaptive dose of H2O2 or not pre-treated. Panel C. MEF cells were prepared, treated with siRNA, transiently adapted to oxidative stress by pre-treatment with H2O2 (or not pre-treated, challenged with 1 mM H2O2 (≈25 μmol H2O2 per 107 cells), and harvested, exactly as described in Panels A and B. Samples were then incubated for a further six hours, harvested, lysed, diluted based on protein content, and then assayed in an oxyblot for protein carbonyls (see Materials & Methods). Values (means ± SE, n = 3) represent the percent increase in protein oxidation (overall carbonyl intensity of anti-DNP antibody staining) of H2O2 challenged (1.0 mM) samples, both H2O2 pre-treated and non-pre-treated ± β1i siRNA’s.

References

    1. Davies KJ. Intracellular proteolytic systems may function as secondary antioxidant defenses: an hypothesis. J Free Radic Biol Med. 1986;2:155–173. - PubMed
    1. Davies KJ, Goldberg AL. Proteins damaged by oxygen radicals are rapidly degraded in extracts of red blood cells. J Biol Chem. 1987;262:8227–8234. - PubMed
    1. Pacifici RE, Kono Y, Davies KJ. Hydrophobicity as the signal for selective degradation of hydroxyl radical-modified hemoglobin by the multicatalytic proteinase complex, proteasome. J Biol Chem. 1993;268:15405–15411. - PubMed
    1. Grune T, Reinheckel T, Davies KJ. Degradation of oxidized proteins in K562 human hematopoietic cells by proteasome. J Biol Chem. 1996;271:15504–15509. - PubMed
    1. Ullrich O, Reinheckel T, Sitte N, Hass R, Grune T, Davies KJ. Poly-ADP ribose polymerase activates nuclear proteasome to degrade oxidatively damaged histones. Proc Natl Acad Sci U S A. 1999;96:6223–6228. - PMC - PubMed

Publication types

MeSH terms