. 2010 Sep 28:4:132.
doi: 10.1186/1752-0509-4-132.

Inferring the conservative causal core of gene regulatory networks

Affiliations

Inferring the conservative causal core of gene regulatory networks

Gökmen Altay et al. BMC Syst Biol. .

Abstract

Background: Inferring gene regulatory networks from large-scale expression data is an important problem that received much attention in recent years. These networks have the potential to gain insights into causal molecular interactions of biological processes. Hence, from a methodological point of view, reliable estimation methods based on observational data are needed to approach this problem practically.

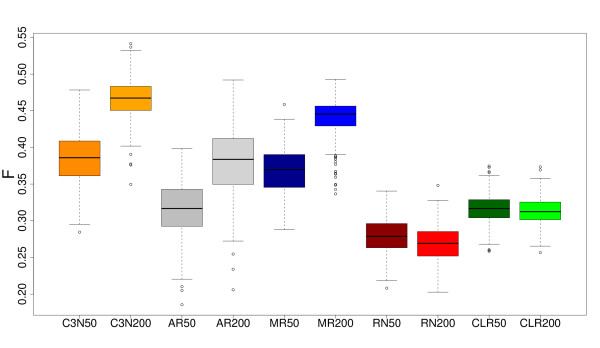
Results: In this paper, we introduce a novel gene regulatory network inference (GRNI) algorithm, called C3NET. We compare C3NET with four well known methods, ARACNE, CLR, MRNET and RN, conducting in-depth numerical ensemble simulations and demonstrate also for biological expression data from E. coli that C3NET performs consistently better than the best known GRNI methods in the literature. In addition, it has also a low computational complexity. Since C3NET is based on estimates of mutual information values in conjunction with a maximization step, our numerical investigations demonstrate that our inference algorithm exploits causal structural information in the data efficiently.

Conclusions: For systems biology to succeed in the long run, it is of crucial importance to establish methods that extract large-scale gene networks from high-throughput data that reflect the underlying causal interactions among genes or gene products. Our method can contribute to this endeavor by demonstrating that an inference algorithm with a neat design permits not only a more intuitive and possibly biological interpretation of its working mechanism but can also result in superior results.


Figures

Figure 1
Figure 1
Visualization of the principle working steps of C3NET and the fact that the final network can have an arbitrary structure.
Figure 2
Figure 2
Boxplots of F-scores for C3NET (orange), ARACNE (gray), MRNET (blue), RN (red) and CLR (green). Dark color (left boxplot) corresponds to sample size 50, light color (right boxplot) to sample size 200. A subnetwork of Yeast GRN is used for the simulations. Ensemble size is N = 300.
Figure 3
Figure 3
Boxplots for the average mutual information values respectively z-scores per significant edge for C3NET (orange), ARACNE (gray), MRNET (blue), RN (red) and CLR (green). Dark color (left boxplot) corresponds to sample size 50, light color (right boxplot) to sample size 200. A subnetwork of Yeast GRN is used for the simulations. Ensemble size is N = 300.
Figure 4
Figure 4
Boxplots for the F-scores for C3NET (orange), ARACNE (gray) and MRNET (blue). A subnetwork of the TRN of E. coli is used for the simulations. Sample size is 1000 and ensemble size is N = 300.
Figure 5
Figure 5
Subnetwork of yeast consisting of 100 genes, sample size is 200. Edge colors are obtained from simulations of 300 data sets. The color of each edge reflects its mean TPR. Specifically, for black edges, 1TPR¯ >0.75, for blue edges, 0.75TPR¯ >0.5, for green edges, 0.5TPR¯ >0.25, and for red edges, 0.25TPR¯0.0.
Figure 6
Figure 6
Subnetwork of E. coli consisting of 100 genes, sample size is 1000. Edge colors are obtained in a similar way as for yeast. Ensemble size is 300.
Figure 7
Figure 7
Inferred E. coli network by C3NET. Pink genes correspond to transcription factors and gray genes to regulated genes. Black edges indicate true positive results whereas red edges correspond to false positives.

References

    1. Emmert-Streib F, Dehmer M, (Eds) Medical Biostatistics for Complex Diseases. Weinheim: Wiley-Blackwell; 2010.
    1. Rual JF, Venkatesan K, Hao T, Hirozane-Kishikawa T. Towards a proteome-scale map of the human protein-protein interaction network. Nature. 2005;437:1173–1178. doi: 10.1038/nature04209. - DOI - PubMed
    1. Schadt E. Molecular networks as sensors and drivers of common human diseases. Nature. 2009;461:218–223. doi: 10.1038/nature08454. - DOI - PubMed
    1. Alon U. An Introduction to Systems Biology: Design Principles of Biological Circuits. Boca Raton, FL: Chapman & Hall/CRC; 2006.
    1. Barabasi AL, Oltvai ZN. Network Biology: Understanding the Cell's Functional Organization. Nature Reviews. 2004;5:101–113. doi: 10.1038/nrg1272. - DOI - PubMed

Publication types

LinkOut - more resources