DNA methylation epigenotypes in breast cancer molecular subtypes
- PMID: 20920229
- PMCID: PMC3096970
- DOI: 10.1186/bcr2721
DNA methylation epigenotypes in breast cancer molecular subtypes
Abstract
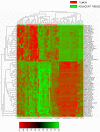
Introduction: Identification of gene expression based breast cancer subtypes is considered as a critical means of prognostication. Genetic mutations along with epigenetic alterations contribute to gene expression changes occurring in breast cancer. So far, these epigenetic contributions to sporadic breast cancer subtypes have not been well characterized, and there is only a limited understanding of the epigenetic mechanisms affected in those particular breast cancer subtypes. The present study was undertaken to dissect the breast cancer methylome and deliver specific epigenotypes associated with particular breast cancer subtypes.
Methods: Using a microarray approach we analyzed DNA methylation in regulatory regions of 806 cancer related genes in 28 breast cancer paired samples. We subsequently performed substantial technical and biological validation by Pyrosequencing, investigating the top qualifying 19 CpG regions in independent cohorts encompassing 47 basal-like, 44 ERBB2+ overexpressing, 48 luminal A and 48 luminal B paired breast cancer/adjacent tissues. Using all-subset selection method, we identified the most subtype predictive methylation profiles in multivariable logistic regression analysis.
Results: The approach efficiently recognized 15 individual CpG loci differentially methylated in breast cancer tumor subtypes. We further identify novel subtype specific epigenotypes which clearly demonstrate the differences in the methylation profiles of basal-like and human epidermal growth factor 2 (HER2)-overexpressing tumors.
Conclusions: Our results provide evidence that well defined DNA methylation profiles enables breast cancer subtype prediction and support the utilization of this biomarker for prognostication and therapeutic stratification of patients with breast cancer.
Figures


References
-
- Perou CM, Sorlie T, Eisen MB, van de Rijn M, Jeffrey SS, Rees CA, Pollack JR, Ross DT, Johnsen H, Akslen LA, Fluge O, Pergamenschikov A, Williams C, Zhu SX, Lønning PE, Børresen-Dale AL, Brown PO, Botstein D. Molecular portraits of human breast tumours. Nature. 2000;406:747–752. doi: 10.1038/35021093. - DOI - PubMed
-
- Sorlie T, Perou CM, Tibshirani R, Aas T, Geisler S, Johnsen H, Hastie T, Eisen MB, van de Rijn M, Jeffrey SS, Thorsen T, Quist H, Matese JC, Brown PO, Botstein D, Eystein Lønning P, Børresen-Dale AL. Gene expression patterns of breast carcinomas distinguish tumor subclasses with clinical implications. Proc Natl Acad Sci USA. 2001;98:10869–10874. doi: 10.1073/pnas.191367098. - DOI - PMC - PubMed
-
- Parker JS, Mullins M, Cheang MC, Leung S, Voduc D, Vickery T, Davies S, Fauron C, He X, Hu Z, Quackenbush JF, Stijleman IJ, Palazzo J, Marron JS, Nobel AB, Mardis E, Nielsen TO, Ellis MJ, Perou CM, Bernard PS. Supervised risk predictor of breast cancer based on intrinsic subtypes. J Clin Oncol. 2009;27:1160–1167. doi: 10.1200/JCO.2008.18.1370. - DOI - PMC - PubMed
Publication types
MeSH terms
Substances
LinkOut - more resources
Full Text Sources
Other Literature Sources
Medical
Molecular Biology Databases
Research Materials
Miscellaneous

