Comparative Study
. 2010 Sep 29:11:526.
doi: 10.1186/1471-2164-11-526.

Comparative transcriptional profiling of the limbal epithelial crypt demonstrates its putative stem cell niche characteristics

Affiliations
Comparative Study

Comparative transcriptional profiling of the limbal epithelial crypt demonstrates its putative stem cell niche characteristics

Bina B Kulkarni et al. BMC Genomics. .

Abstract

Background: The Limbal epithelial crypt (LEC) is a solid cord of cells, approximately 120 microns long. It arises from the undersurface of interpalisade rete ridges of the limbal palisades of Vogt and extends deeper into the limbal stroma parallel or perpendicular to the palisade. There are up to 6 or 7 such LEC, variably distributed along the limbus in each human eye. Morphological and immunohistochemical studies on the limbal epithelial crypt (LEC) have demonstrated the presence of limbal stem cells in this region. The purpose of this microarray study was to characterise the transcriptional profile of the LEC and compare with other ocular surface epithelial regions to support our hypothesis that LEC preferentially harbours stem cells (SC).

Results: LEC was found to be enriched for SC related Gene Ontology (GO) terms including those identified in quiescent adult SC, however similar to cornea, limbus had significant GO terms related to proliferating SC, transient amplifying cells (TAC) and differentiated cells (DC). LEC and limbus were metabolically dormant with low protein synthesis and downregulated cell cycling. Cornea had upregulated genes for cell cycling and self renewal such as FZD7, BTG1, CCNG, and STAT3 which were identified from other SC populations. Upregulated gene expression for growth factors, cytokines, WNT, Notch, TGF-Beta pathways involved in cell proliferation and differentiation were noted in cornea. LEC had highest number of expressed sequence tags (ESTs), downregulated and unknown genes, compared to other regions. Genes expressed in LEC such as CDH1, SERPINF1, LEF1, FRZB1, KRT19, SOD2, EGR1 are known to be involved in SC maintenance. Genes of interest, in LEC belonging to the category of cell adhesion molecules, WNT and Notch signalling pathway were validated with real-time PCR and immunofluorescence.

Conclusions: Our transcriptional profiling study identifies the LEC as a preferential site for limbal SC with some characteristics suggesting that it could function as a 'SC niche' supporting quiescent SC. It also strengthens the evidence for the presence of "transient cells" in the corneal epithelium. These cells are immediate progeny of SC with self-renewal capacity and could be responsible for maintaining epithelial turn over in normal healthy conditions of the ocular surface (OS). The limbus has mixed population of differentiated and undifferentiated cells.


Figures
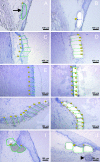
Figure 1
Figure 1
Laser Microdissection (LMD) of the ocular surface epithelial regions. The composite shows steps of LMD performed on radial cut section of LEC (A, B,), limbus (C, D), cornea (E, F), conjunctiva (G, H) and LEC stroma (I, J) at 20× magnification (scale bars shown). Figure 1A is of pre LMD LEC, shown with black arrow. Figure 1 I is of LEC stroma with cells shown with white arrow. Prior to LMD, the sections were stained with RNase free Toluidine Blue. Images (A, C, E, I,) are examples of pre LMD OS epithelial region sections with outlines for laser cuts drawn around the tissue. The junctions between the OS epithelial regions were avoided as it has overlapping features of the two adjacent regions. Image (G) shows cut sections of the epithelial regions. Dividing the epithelium into multiple small pieces facilitated effective catapulting of the tissue into the collection cap. Images (B, D, F, H, J) represent examples of post LMD sections of OS epithelium following pressure catapulting of the epithelial pieces. Image J shows a misdirected piece of LEC Stroma which was not captured in the cap but settled down over the adjacent LEC Stroma (black arrow head); such tissue pieces could be recatapulted into the cap with dot LPC laser function.
Figure 2
Figure 2
Principal Component Analysis (PCA) plot of microarray samples and genes. Left image shows PCA of LEC vs ALL samples following feature subset analysis performed on Jexpresspro software. The LEC samples are represented as green dots and rest of the samples as blue dots. LEC biological replicates are seen to cluster separately from rest of the samples indicating differences between LEC and other sample groups but similarity or reproducibility between LEC replicates. Right image shows PCA of differentially expressed genes (527) between LEC and cornea. These are clustered into four distinct coloured groups according to the density. The red group has the highest density and blue the lowest, black dots in the centre are unclustered genes.
Figure 3
Figure 3
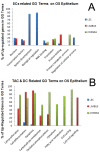
Composite image of Gene Ontology graphs. Bar graph (A) shows statistically significant (p value ≤ 0.05) SC related GO terms in LEC, Limbus and cornea. Bar graph (B) represents statistically significant (p value ≤ 0.05) TAC and DC related GO terms in LEC, limbus and cornea. In both graphs A and B the x and y axes indicate the GO terms related to gene functions and percentages of differentially expressed upregulated genes in each category respectively. Absent bar chart for particular GO term in a region was either because of downregulated or absent gene expression.
Figure 4
Figure 4
Composite image of graphs of Real Time PCR performed on genes of interest. The real time PCR was performed on OS epithelial regions of LEC, cornea, limbus and conjunctiva comprising of three biological replicates (3 eyes) with four sets of technical replicates A, B, C & D. These were processed in triplicate. The cycle threshold (Ct) value for these samples were averaged and normalised with 18S rRNA Ct values. Significant p values between LEC and other OS regions is shown as (*),*p < 0.05, ***p < 0.001. Data are expressed as means +/- standard errors of the mean (SEM).
Figure 5
Figure 5
Immuno-fluorescent staining for expression of stem cell molecules on ocular surface epithelium. Immunofluorescence with HES1 and FRZB1 was performed on radial cut sections of LEC (A, B, K, L), limbus (C, D, M, N) cornea (E, F, O, P) and tonsil (G, H, Q, R). Images (K, L, G, H, Q, R, I, J) are at 40× magnification, the remainder are at 20× magnification (scale bars shown). HES1 immunofluorescence co-localised with DAPI nuclear dye is shown in images (B. D, F, H,). Images (A, C, E, G) show HES1 (TRITC) staining. FRZB1 immunofluorescence co-localised with DAPI dye is shown in images (L, N, P, R). Images (K, M, O, Q,) are of FRZB1 with TRITC dye. Positive staining for HES1 and FRZB1 (B, D, F, H), (N, P, R) is seen as whitish nuclear stain, due to co-localisation of FRZB1 and HES1 (TRITC dye) and nuclear stain DAPI in the cell nuclei. FRZB1 immunofluorescence of LEC (L) is seen as yellow colouration as it intensely stained the nuclei of the basal epithelial cells in the LEC and masked the underlying DAPI staining. Positive nuclear staining of Tonsil with HES1 antibody (G, H) has speckled appearance and FRZB1 (Q, R) appears as a rim around the cell nucleus. Images (I, J) and (S, T) are negative controls for HES1 and FRZB1 antibody respectively.

References

    1. Schermer A, Galvin S, Sun TT. Differentiation-related expression of a major 64 K corneal keratin in vivo and in culture suggests limbal location of corneal epithelial stem cells. J Cell Biol. 1986;103:49–62. doi: 10.1083/jcb.103.1.49. - DOI - PMC - PubMed
    1. Di Iorio E, Barbaro V, Ferrari S, Ortolani C, De Luca M, Pellegrini G. Q-FIHC: quantification of fluorescence immunohistochemistry to analyse p63 isoforms and cell cycle phases in human limbal stem cells. Microsc Res Tech. 2006;69:983–991. doi: 10.1002/jemt.20375. - DOI - PubMed
    1. Schlotzer-Schrehardt U, Kruse FE. Identification and characterization of limbal stem cells. Exp Eye Res. 2005;81:247–264. - PubMed
    1. Kasper M. Patterns of cytokeratins and vimentin in guinea pig and mouse eye tissue: evidence for regional variations in intermediate filament expression in limbal epithelium. Acta Histochem. 1992;93:319–332. - PubMed
    1. Cotsarelis G, Cheng SZ, Dong G, Sun TT, Lavker RM. Existence of slow-cycling limbal epithelial basal cells that can be preferentially stimulated to proliferate: implications on epithelial stem cells. Cell. 1989;57:201–209. doi: 10.1016/0092-8674(89)90958-6. - DOI - PubMed

Publication types

MeSH terms