. 2010 Oct 1:5:26.
doi: 10.1186/1749-8104-5-26.

Drosophila type II neuroblast lineages keep Prospero levels low to generate large clones that contribute to the adult brain central complex

Affiliations

Drosophila type II neuroblast lineages keep Prospero levels low to generate large clones that contribute to the adult brain central complex

Omer Ali Bayraktar et al. Neural Dev. .

Abstract

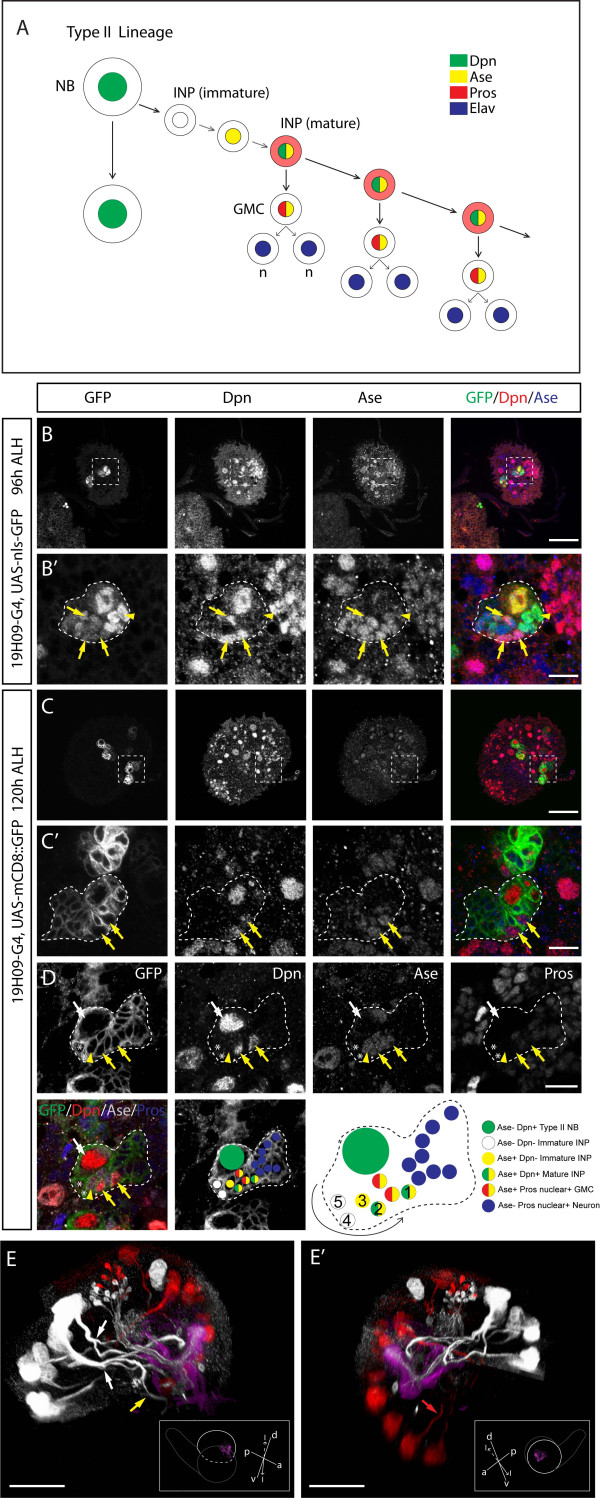
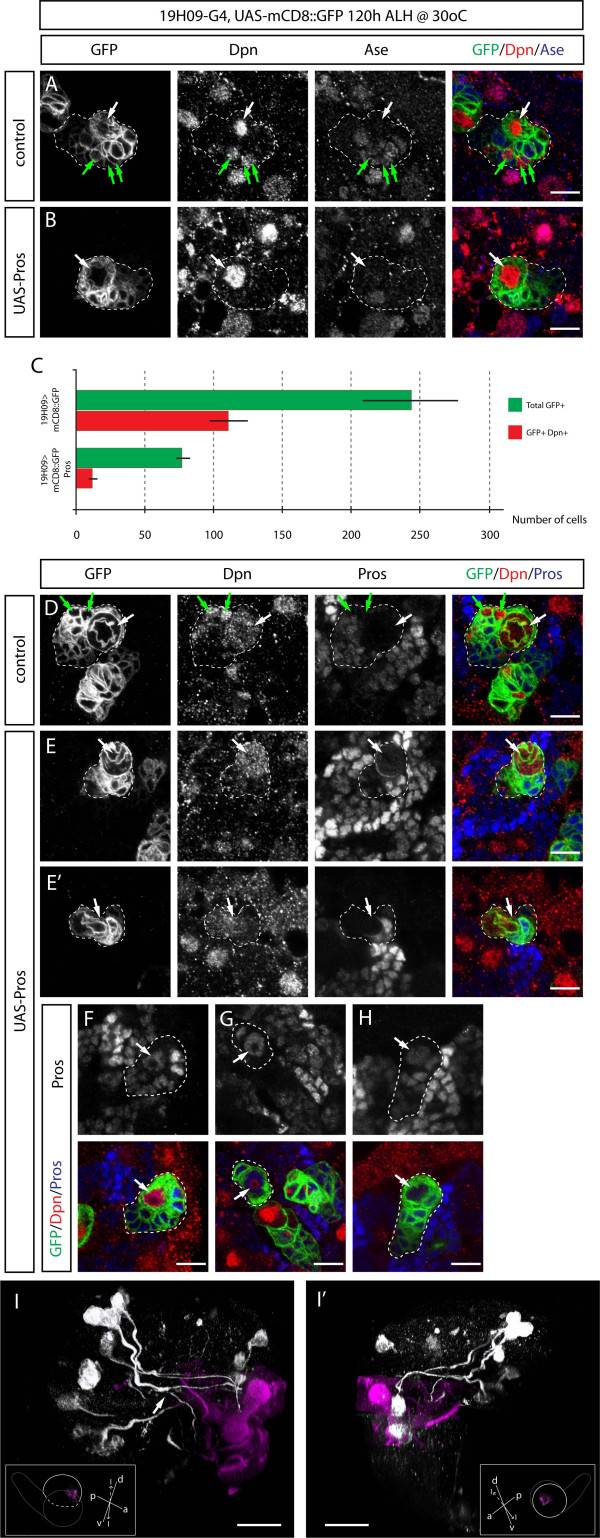
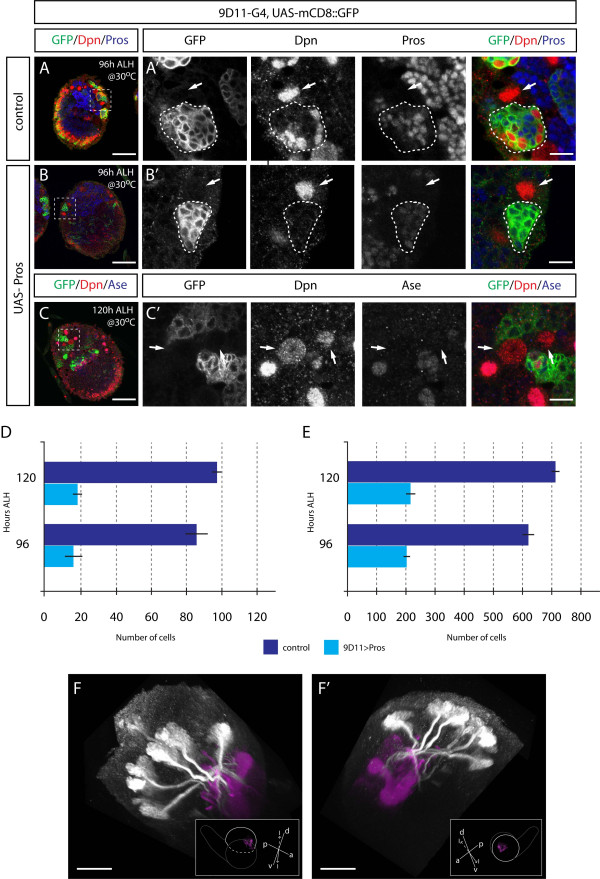
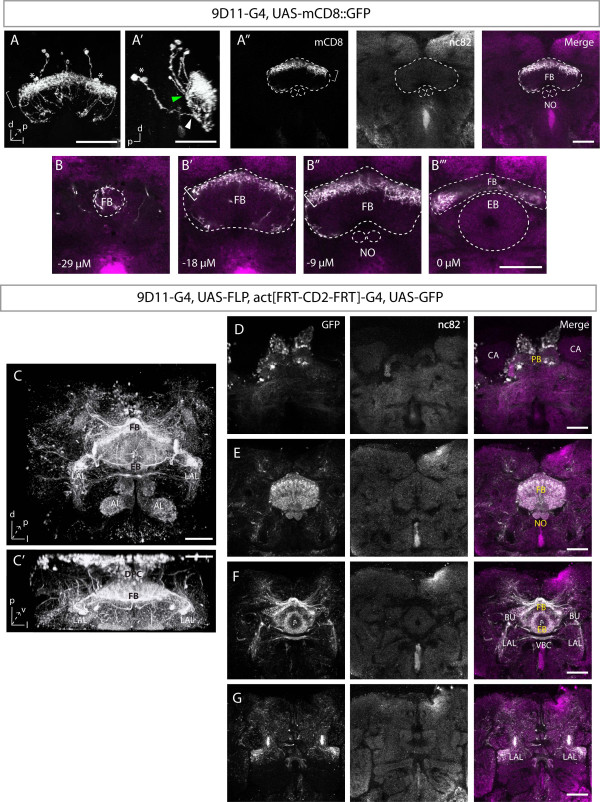
Tissue homeostasis depends on the ability of stem cells to properly regulate self-renewal versus differentiation. Drosophila neural stem cells (neuroblasts) are a model system to study self-renewal and differentiation. Recent work has identified two types of larval neuroblasts that have different self-renewal/differentiation properties. Type I neuroblasts bud off a series of small basal daughter cells (ganglion mother cells) that each generate two neurons. Type II neuroblasts bud off small basal daughter cells called intermediate progenitors (INPs), with each INP generating 6 to 12 neurons. Type I neuroblasts and INPs have nuclear Asense and cytoplasmic Prospero, whereas type II neuroblasts lack both these transcription factors. Here we test whether Prospero distinguishes type I/II neuroblast identity or proliferation profile, using several newly characterized Gal4 lines. We misexpress prospero using the 19H09-Gal4 line (expressed in type II neuroblasts but no adjacent type I neuroblasts) or 9D11-Gal4 line (expressed in INPs but not type II neuroblasts). We find that differential prospero expression does not distinguish type I and type II neuroblast identities, but Prospero regulates proliferation in both type I and type II neuroblast lineages. In addition, we use 9D11 lineage tracing to show that type II lineages generate both small-field and large-field neurons within the adult central complex, a brain region required for locomotion, flight, and visual pattern memory.


Figures

Figure 1
Figure 1
19H09-Gal4 labels a subset of type II neuroblasts and their progeny. (A) Type II NB lineage summary, modified from [4]. (B-D) Confocal images of third instar larval brains expressing nls::GFP (B) or mCD8::GFP (C) under 19H09-Gal4 stained for indicated markers (white box). Low magnification images of single brain lobes are presented in (B,C) and high magnification images of boxed areas are presented in (B',C'), respectively. (D) A high magnification image of a type II NB and associated progeny from a different brain. The white dotted outlines represent the green fluorescent protein (GFP)-labeled areas. Type II NB are large Dpn+ Ase- cells (white arrows). Ase- Dpn- immature INPs next to type II NBs are indicated with asterisks, Ase+ Dpn- immature INPs close to type II NBs are indicated with arrowheads and mature INPs are indicated with yellow arrows. The type II lineage shown in (D) is diagrammed below indicating the different kinds of cells in the lineage. The birth order of the cells was inferred from their relative position to the parental NB: newly born cells (5) are in direct contact with the type II NB while earlier-born cells (1) and their progeny are displaced and found further away. (E,E') Three-dimensional reconstruction of medial (E) and lateral (E') views of a 120 h ALH (after larval hatching) brain lobe expressing mCD8::GFP under control of 19H09-Gal4. Type II lineages and their axonal projections are in white, the mushroom body, visualized by FasII, in magenta, and type I lineages and their projections in red. Additionally, a subset of neurons that project to the mushroom body are visualized by the driver. The optic lobes have been removed and the brain cropped for a clearer view. Brains (gray outline) are in the orientations shown in the insets, with imaged lobes indicated with a white dashed line and their mushroom bodies shown. The rest of the brain apart from the imaged lobes is indicated in white outline. Split axon tracts of type II lineages are indicated with white arrows, the yellow arrow points at a commissural projection from a type II lineage, and the red arrow points at a type I projection. Orientation: d, dorsal; v, ventral; p, posterior; l, lateral; m, medial. Scale bars: (B,C) 50 μM; (B',C',D) 10 μM; (E,E') 40 μM.
Figure 2
Figure 2
9D11 specifically labels INPs and their progeny within the central brain. (A,B,D-F) Confocal images of first (A) and third (B,D,E,F) instar larval brains expressing nls-GFP (A,B) or mCD8::GFP (D-F) under 9D11-Gal4 stained for indicated markers (white boxes). Low magnification images of single brain lobes are presented in (A-F), and high magnification images of boxed areas are presented in (A'-F'), respectively. White outlines represent the GFP-labeled areas; yellow outlines represent NB lineages visualized by Discs-large (Dlg) staining. Type II NBs are indicated with white arrows; Ase- Dpn- immature INPs next to type II NBs are indicated with asterisks; Ase+ Dpn- immature INPs close to type II NBs are indicated with arrowheads. Mature INPs are small Dpn+ cells in white outlined areas or indicated with yellow arrows. (E) Green arrows point at the two lateral type II NBs. (C) Histogram showing increasing number of INPs and total cells labeled by nls-GFP driven by 9D11-gal4 between 24 and 96 h ALH. Error bars indicate standard deviation. (G,G') Three-dimensional reconstruction of medial (G) and lateral (G') views of a 120 h ALH brain lobe expressing mCD8::GFP under control of 9D11-Gal4. Type II lineages and their axonal projections are shown in white, and the mushroom body, visualized by FasII, is shown in magenta. The optic lobe is removed and the brain cropped for a clearer view. See text for lineage labels. Brains (gray outline) are in the orientations shown in the insets, with imaged lobes indicated with a white dashed line and their mushroom bodies shown, same as in Fig. 1. White arrows point at commissural projections and arrowheads point at descending ipsilateral projections from type II lineages. The yellow arrow points at the dorsoposterior commissure. Type II lineages were labeled according to [12]. Orientation: d, dorsal; v, ventral; p, posterior; l, lateral; m, medial. Scale bars: (A) 20 μM; (B-F) 50 μM; (A'-F') 10 μM; (G,G') 40 μM. CM, centromedial lineages. DPMm, medial dorsoposterior lineages, medial subgroup. DPMpm, medial dorsoposterior lineages, posteromedial subgroup.
Figure 3
Figure 3
Prospero misexpression in type II NBs reduces lineage size but does not induce type I NB identity. (A,B,D-H) High magnification confocal images of type II NBs and associated progeny from third instar larval brains expressing mCD8::GFP (A,D) or mCD8::GFP and Pros (B,E-H) under control of 19H09-Gal4. White outlines represent the GFP labeled areas. Type II NBs are indicated with white arrows and mature INPs are indicated with green arrows. (C) Histogram showing number of INPs and total cells labeled by mCD8::GFP driven by 19H09-gal4 in control and pros overexpression brains at 120 h ALH. Error bars indicate standard deviation. (I,I') Three-dimensional reconstruction of medial (I) and lateral (I') views of a 120 h ALH brain lobe expressing mCD8::GFP and Pros under control of 19H09-Gal4. Type II lineages and their axonal projections are showm in white, and the mushroom body, visualized by FasII, is shown in magenta. The optic lobe is removed and the brain cropped for a clearer view. Brains are in the orientations shown in the insets, with imaged lobes indicated with a white dashed line and their mushroom bodies shown. The white arrow points at a split axon tract from a type II lineage. Orientation: d, dorsal; v, ventral; p, posterior; l, lateral; m, medial. Scale bars: (A-E) 10 μM; (F,F') 40 μM.
Figure 4
Figure 4
Prospero misexpression suppresses INP proliferation. (A-C) Confocal images of third instar larval brains expressing mCD8::GFP (A) or mCD8::GFP and Pros (B,C) under 9D11-Gal4 stained for indicated markers (white boxes). Low magnification images of single brain lobes are presented in (A-C), and higher magnification images of boxed areas are presented in (A'-C'), respectively. White outlines represent the GFP-labeled areas. Type II NB are indicated with white arrows; mature INPs are small Dpn+ cells in white outlined areas. (D,E) Histograms showing number of INPs (D) and total cells (E) labeled by mCD8::GFP driven by 9D11-gal4 in control and prospero overexpression brains at 96 and 120 h ALH. (F,F') Three-dimensional reconstruction of medial (F) and lateral (F') views of a 120 h ALH brain lobe expressing mCD8::GFP and UAS-Prospero under control of 9D11-Gal4. Type II lineages and their axonal projections are shown in white, and the mushroom body, visualized by FasII, is shown in magenta. The optic lobe is removed and the brain cropped for a clearer view. Brains are in the orientations shown in the insets, with imaged lobes indicated with a white dashed line and their mushroom bodies shown. Orientation: d, dorsal; v, ventral; p, posterior; l, lateral; m, medial. Scale bars: (A-C) 50 μM; (A'-C') 10 μM; (F,F') 40 μM.
Figure 5
Figure 5
Lineage tracing with 9D11 labels the adult central complex and associated regions. (A,B) 9D11 expression in the adult brain stained for mCD8 (white) and synaptic marker nc82 (magenta). (A,A') Frontal (A) and sagittal (A') views of the three-dimensional reconstruction of mCD8::GFP confocal z-stacks, close up on the FB. Three cell pairs are located dorsal to the FB while two cell pairs are more ventral at the level of the dorsal FB (asterisks). The projections from the dorsal cell pairs enter the dorsal FB at medial sites (green arrowhead) while the projections of ventral pairs enter the dorsal FB at more anterolateral sites (white arrowhead). See Additional file 5 for the three-dimensional reconstruction. (A'') Single frontal confocal section of the same brain at the level of the FB. (B-B''') Serial higher magnification frontal confocal sections of the central complex from posterior to anterior. Cell bodies are posterior to (B). White brackets indicate the dense dorsal layer of innervations at the FB. White outlines represent the neuropils visualized by nc82 staining (labeled). (C-G) Lineage tracing with 9D11-Gal4 in the adult brain stained for GFP (white) and nc82 (magenta). (C,C') Frontal (C) and dorsal (C') views of the three-dimensional reconstruction of GFP confocal z-stacks. (C) Most cell bodies in the posterior cortex were removed for easier viewing. (D-G) Serial frontal confocal sections of the same brain from posterior to anterior show labeling at the PB and cell bodies in the posterior brain (D), the FB and NO (E), the anterior FB, EB, LALs, and BUs (F), and the LALs and middle brain (G). CA, calx. VBC, ventral body commissure. See Additional file 6 for more representative stacks, Additional file 8 for high magnification images of the central complex, and Additional file 7 for the three-dimensional reconstruction. Orientation: d, dorsal; v, ventral; p, posterior; l, lateral. Scale bars: 40 μM.

References

    1. Doe CQ. Neural stem cells: Balancing self-renewal with differentiation. Development. 2008;135:1575–1587. doi: 10.1242/dev.014977. - DOI - PubMed
    1. Knoblich JA. Mechanisms of asymmetric stem cell division. Cell. 2008;132:583–597. doi: 10.1016/j.cell.2008.02.007. - DOI - PubMed
    1. Bello BC, Izergina N, Caussinus E, Reichert H. Amplification of neural stem cell proliferation by intermediate progenitor cells in Drosophila brain development. Neural Develop. 2008;3:5. doi: 10.1186/1749-8104-3-5. - DOI - PMC - PubMed
    1. Boone JQ, Doe CQ. Identification of Drosophila type II neuroblast lineages containing transit amplifying ganglion mother cells. Dev Neurobiol. 2008;68:1185–1195. doi: 10.1002/dneu.20648. - DOI - PMC - PubMed
    1. Bowman SK, Rolland V, Betschinger J, Kinsey KA, Emery G, Knoblich JA. The Tumor Suppressors Brat and Numb Regulate Transit-Amplifying Neuroblast Lineages in Drosophila. Dev Cell. 2008;14:535–546. doi: 10.1016/j.devcel.2008.03.004. - DOI - PMC - PubMed

Publication types

MeSH terms