. 2010 Oct 1:10:90.
doi: 10.1186/1471-2288-10-90.

Evidence at a glance: error matrix approach for overviewing available evidence

Affiliations

Evidence at a glance: error matrix approach for overviewing available evidence

Frederik Keus et al. BMC Med Res Methodol. .

Abstract

Background: Clinical evidence continues to expand and is increasingly difficult to overview. We aimed at conceptualizing a visual assessment tool, i.e., a matrix for overviewing studies and their data in order to assess the clinical evidence at a glance.

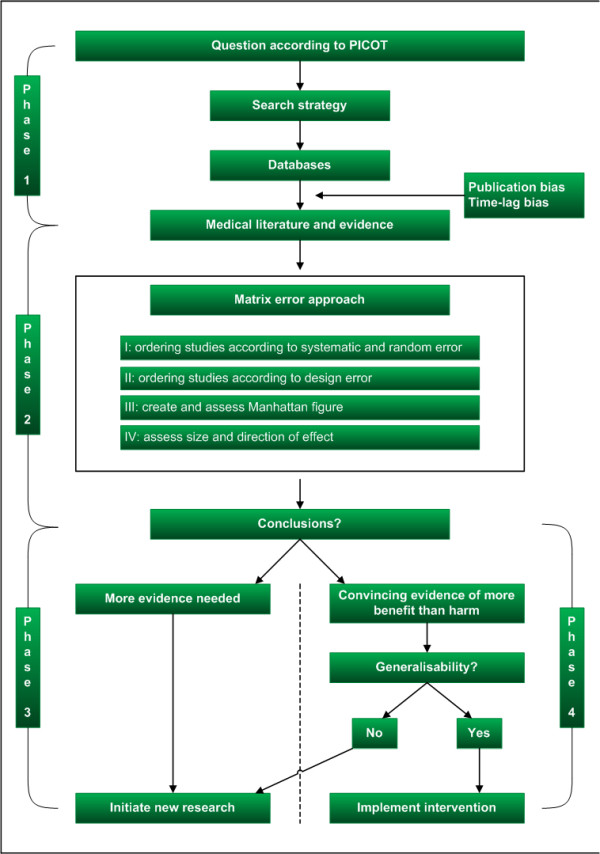
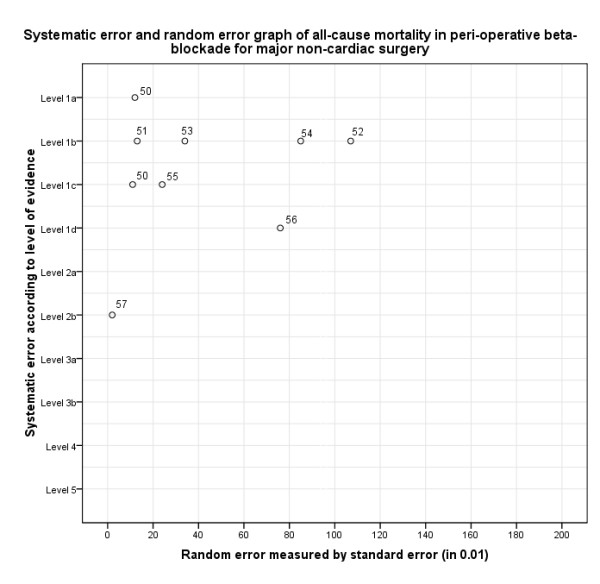
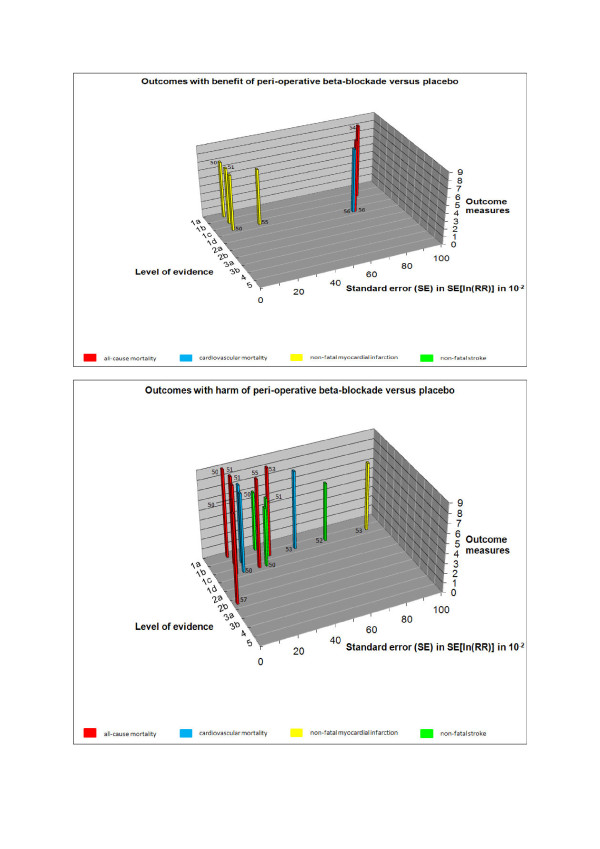
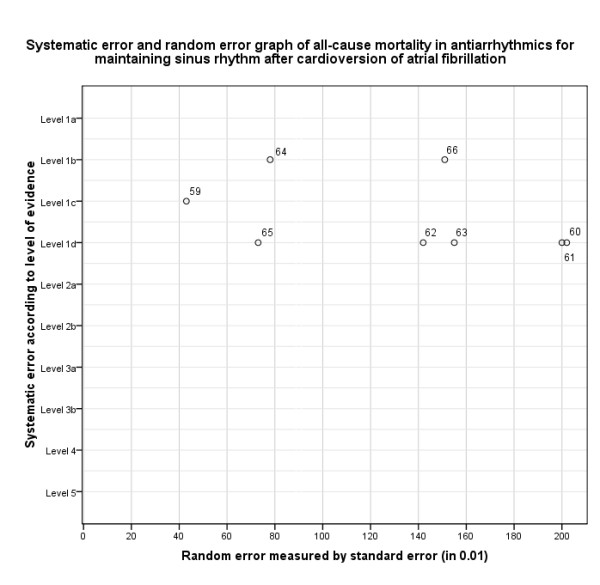
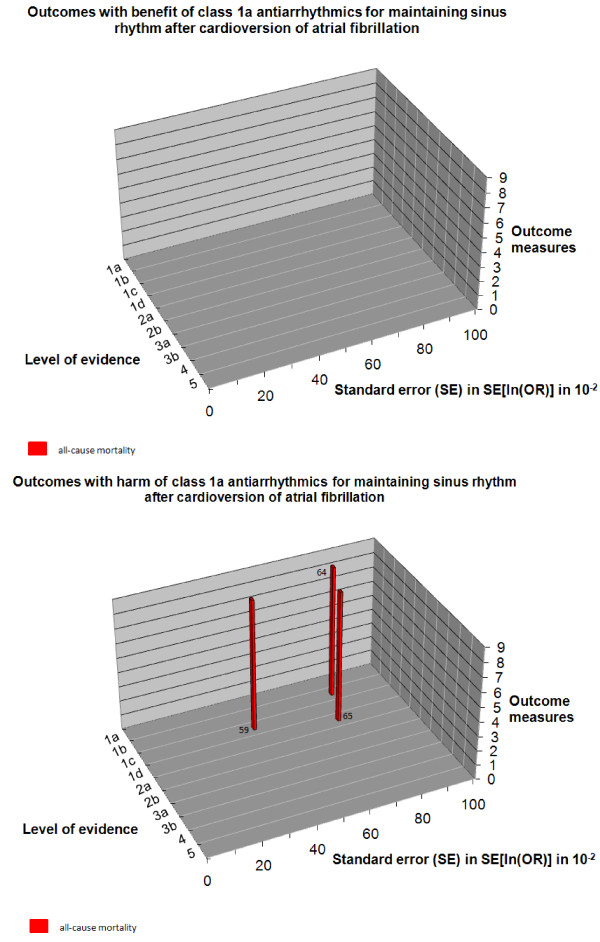
Methods: A four-step matrix was constructed using the three dimensions of systematic error, random error, and design error. Matrix step I ranks the identified studies according to the dimensions of systematic errors and random errors. Matrix step II orders the studies according to the design errors. Matrix step III assesses the three dimensions of errors in studies. Matrix step IV assesses the size and direction of the intervention effect.

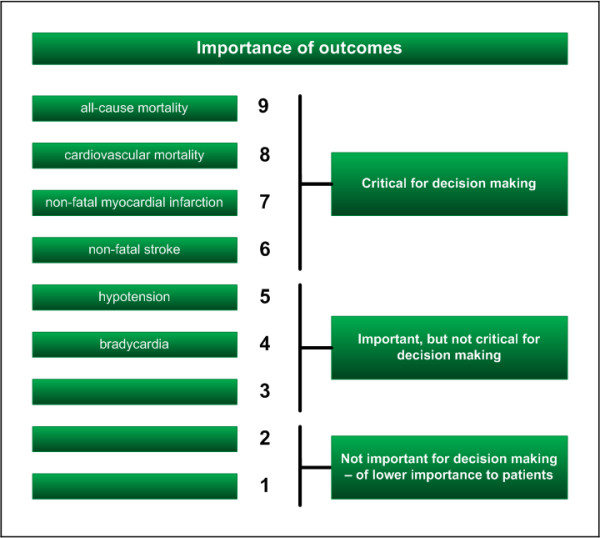
Results: The application of this four-step matrix is illustrated with two examples: peri-operative beta-blockade initialized in relation to surgery versus placebo for major non-cardiac surgery, and antiarrhythmics for maintaining sinus rhythm after cardioversion of atrial fibrillation. When clinical evidence is deemed both internally and externally valid, the size of the intervention effect is to be assessed.

Conclusion: The error matrix provides an overview of the validity of the available evidence at a glance, and may assist in deciding which interventions to use in clinical practice.


Figures

Figure 1
Figure 1
Overview of the four phases in the process of evidence-based medicine from question to the initiation of new research or implementation of new evidence. PICOT: patients, intervention, control, outcome measure, time.
Figure 2
Figure 2
Hierarchy of outcomes according to importance to non-cardiac surgery patients undergoing preventive beta-blocker intervention [13]. Some outcome measures may be correlated (e.g. cardiovascular mortality is included in all-cause mortality)
Figure 3
Figure 3
Matrix step I, ordering of evidence according to systematic error (in levels of evidence) and random error (measured by standard error) considering all-cause mortality in peri-operative beta-blockade versus placebo for major non-cardiac surgery (example 1).
Figure 4
Figure 4
Matrix step II, ordering of evidence on peri-operative beta-blockade versus placebo for major non-cardiac surgery according to importance of outcome measures (design error) and levels of evidence (systematic error) (example 1). The outcome measures have been adapted to the beta-blockade question.
Figure 5
Figure 5
Manhattan-like three-dimensional matrix building upon the risks of systematic error, random error, and design error. The evidence with the lowest systematic, random, and design error is represented by the tallest skyscrapers, located on 'the upper west side'. a. Outcomes with benefit of peri-operative beta-blockade versus placebo. b. Outcomes with harm of peri-operative beta-blockade versus placebo. A 'quick guide' to the perception of the figure: If you want to know what the evidence is for peri-operative beta-blockade to influence myocardial infarction: go to the yellow bars and read 1) Level of evidence (the risk of systematic error) and 2) standard error (the risk of random error). Data with risk of systematic error >level 2b and random error SE >1.0 were omitted from the figure. The guidelines, which advocate the use of peri-operative beta-blockade, were not included in this figure since the systematic error is level 5 and the random error cannot be calculated (not based on data) [58]. The SE of outcomes with zero events cannot be calculated either. From these 'benefit' and 'harm' Manhattan figures, one can see at a glance that beta-blockers may provide benefit to patients in terms of nonfatal myocardial infarction (yellow bars). However, one can also see that beta-blockers may cause harm to patients in terms of all-cause mortality (red bars), cardiovascular mortality (blue bars), and nonfatal stroke (green bars). Reading the dimension of systematic error it is immediately clear that there is level 1a evidence available for all these four outcome measures. Reading the dimension of random error on this systematic error level of evidence shows that there is a small risk of random error considering all-cause mortality (0,12), cardiovascular mortality (0,16), and nonfatal myocardial infarction (0,10), and a moderate risk of random error considering nonfatal stroke (0,28). It is clear at a glance that the best available evidence does not support peri-operative beta-blockade for major non-cardiac surgery. SE = 0 to 0,10 = ignorable risk of random error. SE = 0,10 to 0,20 = small risk of random error. SE = 0,20 to 0,30 = moderate risk of random error. SE = 0,30 to 0,50 = substantial risk of random error. SE = >0,50 = high risk of random error. A clean version for creating a Manhattan figure can be obtained at the Copenhagen Trial Unit's homepage (http://ctu.rh.dk).
Figure 6
Figure 6
Matrix step I, ordering of evidence according to systematic error (in levels of evidence) and random error (measured by standard error) considering all-cause mortality in antiarrhythmics for maintaining sinus rhythm after cardioversion of atrial fibrillation (example 2). Compare this figure with Figure 3: the studies in this figure are located on the right side of the figure (all SE >0.40), in contrast with Figure 3 where the studies are concentrated on the upper left side of the figure (six studies with SE < 0.40).>
Figure 7
Figure 7
Manhattan-like three-dimensional matrix building upon the risks of systematic error, random error, and design error. The evidence with the lowest systematic, random, and design error is represented by the tallest skyscrapers, located on 'the upper west side'. a. Outcomes with benefit of antiarrhythmics for maintaining sinus rhythm after cardioversion of atrial fibrillation. b. Outcomes with harm of antiarrhythmics for maintaining sinus rhythm after cardioversion of atrial fibrillation. A 'quick guide' to the perception of the figure: If you want to know what the evidence is for antiarrhythmics for maintaining sinus rhythm after cardioversion of atrial fibrillation to influence all-cause mortality: go to the red bars and read 1) Level of evidence (the risk of systematic error) and 2) standard error (the risk of random error). Only the Cochrane review and the trials included in this systematic review were considered in this example. Data with risk of random error SE >1.0 were omitted from the figure. The SE of outcomes with zero events cannot be calculated. From these 'benefit' and 'harm' Manhattan figures, one can see at a glance that there is no benefit at all and that 'the upper west side' is empty. Class 1a antiarrhythmics might increase mortality; however, since high risks for both systematic error and random error are present there is insufficient evidence for reliable conclusions.

References

    1. Evidence-Based Medicine Working Group. Evidence-based medicine. A new approach to teaching the practice of medicine. JAMA. 1992;268:2420–5. doi: 10.1001/jama.268.17.2420. - DOI - PubMed
    1. Sutton AJ, Higgins JPT. Recent developments in meta-analysis. Stat Med. 2008;27:625–50. doi: 10.1002/sim.2934. - DOI - PubMed
    1. Straus SE, Richardson WS, Glasziou P, Haynes RB. Evidence-based medicine. How to practice and teach EBM. Edinburgh, UK: Churchill Livingstone; 2005.
    1. Higgins JPT, Green S. Cochrane Handbook for Systematic Reviews of Interventions. The Cochrane Collaboration; 2008.
    1. Popper KR. Logik der Forschung. Vienna: Springer; 1959.

Substances

LinkOut - more resources