. 2011 Mar 22:1380:138-45.
doi: 10.1016/j.brainres.2010.09.101. Epub 2010 Oct 1.

Brain growth across the life span in autism: age-specific changes in anatomical pathology

Affiliations

Brain growth across the life span in autism: age-specific changes in anatomical pathology

Eric Courchesne et al. Brain Res. .

Abstract

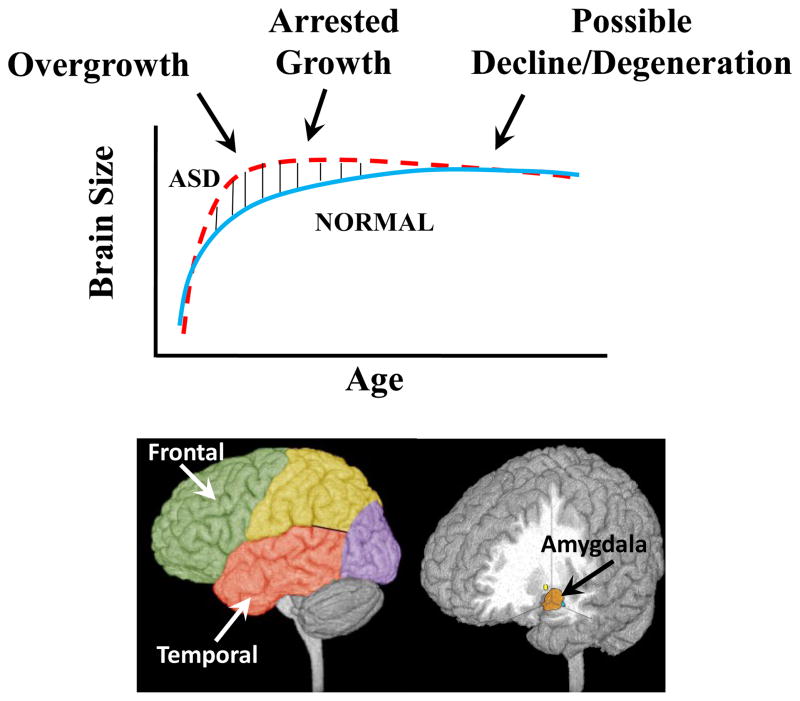
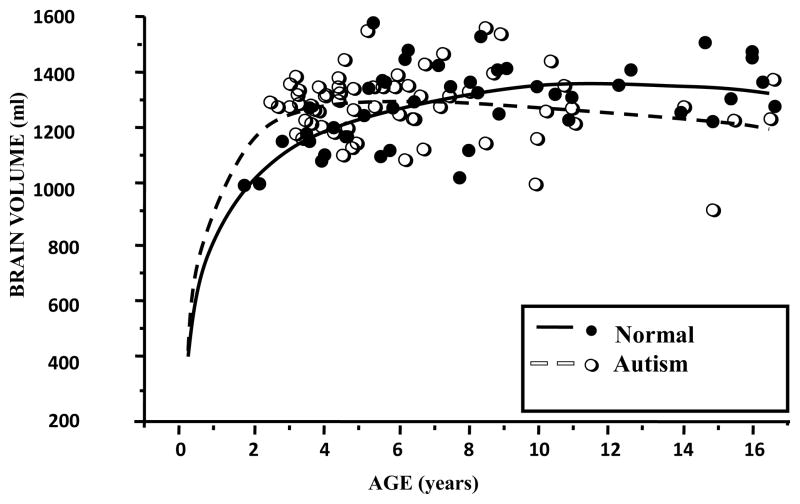
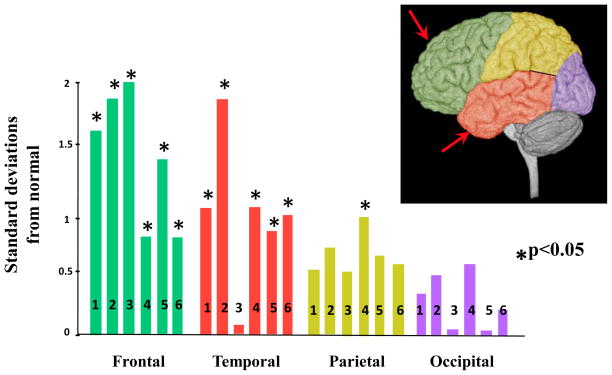
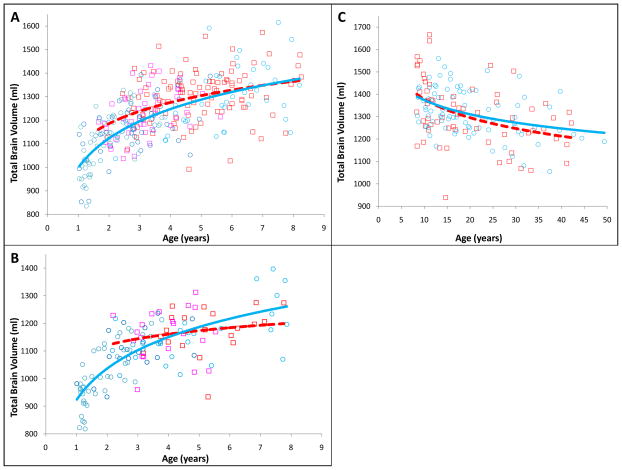
Autism is marked by overgrowth of the brain at the earliest ages but not at older ages when decreases in structural volumes and neuron numbers are observed instead. This has led to the theory of age-specific anatomic abnormalities in autism. Here we report age-related changes in brain size in autistic and typical subjects from 12 months to 50 years of age based on analyses of 586 longitudinal and cross-sectional MRI scans. This dataset is several times larger than the largest autism study to date. Results demonstrate early brain overgrowth during infancy and the toddler years in autistic boys and girls, followed by an accelerated rate of decline in size and perhaps degeneration from adolescence to late middle age in this disorder. We theorize that underlying these age-specific changes in anatomic abnormalities in autism, there may also be age-specific changes in gene expression, molecular, synaptic, cellular, and circuit abnormalities. A peak age for detecting and studying the earliest fundamental biological underpinnings of autism is prenatal life and the first three postnatal years. Studies of the older autistic brain may not address original causes but are essential to discovering how best to help the older aging autistic person. Lastly, the theory of age-specific anatomic abnormalities in autism has broad implications for a wide range of work on the disorder including the design, validation, and interpretation of animal model, lymphocyte gene expression, brain gene expression, and genotype/CNV-anatomic phenotype studies.


Figures

Figure 1
Figure 1
Three Phases of Growth Pathology in Autism (A) Model of early brain overgrowth that is followed by arrest of growth. Red line represents ASD, while blue line represents age-matched typically developing individuals. In some regions and individuals, the arrest of growth may be followed by degeneration, indicated by the red dashes that slope slightly downward. (B) Sites of regional overgrowth in ASD include frontal and temporal cortices, and amygdala. (from Courchesne et al., 2007)
Figure 2
Figure 2
Brain Growth in Autism through 16 years. Data plot shows individual MRI-based volumes in autistic 2–4 year old males as compared to the average volume in typical 2–4 year old males and smaller overall brain volumes by 8 –16 years of age (from Courchesne et al. 2001).
Figure 3
Figure 3
Gray Matter overgrowth in Autism. The bars represent abnormalities in Different Cerebral Regions (standard deviations from normal average) in Children and Adolescents with ASD. Note the general gradient of abnormality with frontal and temporal regions most abnormally enlarged. References: 1, Carper et al., 2002 3.4 years; 2, Bloss and Courchesne, 2007 3.8 years; 3, Kates et al., 2004 (7.6 years); 4, Palmen et al., 2005 11.1 years; 5, Hazlett et al., 2005 19.1; 6. Schumann et al,. 2010 2–4 years. (From Courchesne et al, 2007)
Figure 4
Figure 4
Changes in Brain Growth Across the Lifespan in ASD. Total Brain Volume is shown for ASD (squares) and Control (circles) subjects for A) Males ages 1 to 9 years B) Females ages 1 to 9 years C) Males ages 9 to 50 years. Different colored markers represents the 3 different source datasets. The red, dotted lines represent growth trajectories of ASD subjects. The blue solid lines represent the growth trajectories of Control subjects. Data from 586 longitudinal and cross-sectional MRI scans.
Figure 5
Figure 5
Cerebellum and Vermis Size from Infancy to Adulthood in Autism. Percent differences from normal average in each study for autistic subjects are plotted for cerebellar volume (blue diamonds) and vermis lobules VI–VII cross-sectional area (red squares) against age. Regression lines are shown for cerebellar volume and vermis lobules VI–VII area. The solid line represents normal average. Each number represents a separate study: 1, Hashimoto et al., 1995; 2, Courchesne et al., 2001; 3, Akshoomoff et al., 2004; 4, Webb et al., 2009; 5, Carper et al., 2000; 6, Kleiman et al., 1992; 7, Kaufmann et al., 2003; 8, Kates et al., 2004; 9, Mitchell et. al., 2009; 10, Herbert et al., 2003; 11, Elia et al., 2000; 12, Cleavinger et. al., 2008; 13, Ciesielski et al., 1997; 14, Hardan et al., 2001; 15, Piven et al., 1992; 16, Hallahan et. al, 2009. Data point from first report of hypoplasia of vermis lobules VI–VII Courchesne et al., 1988 shown as red asterisk.

References

    1. Akshoomoff N, Lord C, Lincoln AJ, Courchesne RY, Carper RA, Townsend J, Courchesne E. Outcome classification of preschool children with autism spectrum disorders using MRI brain measures. J Am Acad Child Adolesc Psychiatry. 2004;43:349–357. - PubMed
    1. Aylward E, Minshew MD, Goldstein G, Honeycutt NA, Augustine AM, Yates KO, Barta PE, Pearlson GD. MRI volumes of amygdale and hippocampus in non-mentally retarded autistic adolescence and adults. Neurology. 1999;53:2145–2150. - PubMed
    1. Araghi-Niknam M, Fatemi SH. Levels of Bcl-2 and P53 are altered in superior frontal and cerebellar cortices of autistic subjects. Cell Mol Neurobiol. 2003;23:945–952. - PMC - PubMed
    1. Amaral D, Schumann CM, Nordahl CW. Neuroanatomy of autism. Trends in Neurosciences. 2008;31:137–145. - PubMed
    1. Bailey A, Luthert P, Dean A, Harding B, Janota I, Montgomery M, Rutter M, Lantos P. A clinicopathological study of autism. Brain Research. 1998;121:889–905. - PubMed

Publication types

MeSH terms