. 2010 Oct 4;191(1):115-28.
doi: 10.1083/jcb.201004118.

Kinesin-1 and dynein at the nuclear envelope mediate the bidirectional migrations of nuclei

Affiliations

Kinesin-1 and dynein at the nuclear envelope mediate the bidirectional migrations of nuclei

Heidi N Fridolfsson et al. J Cell Biol. .

Abstract

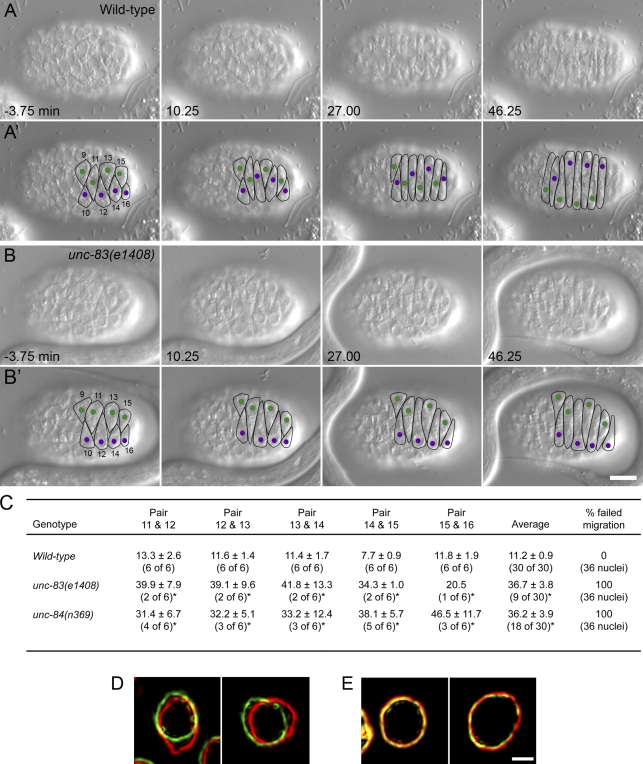
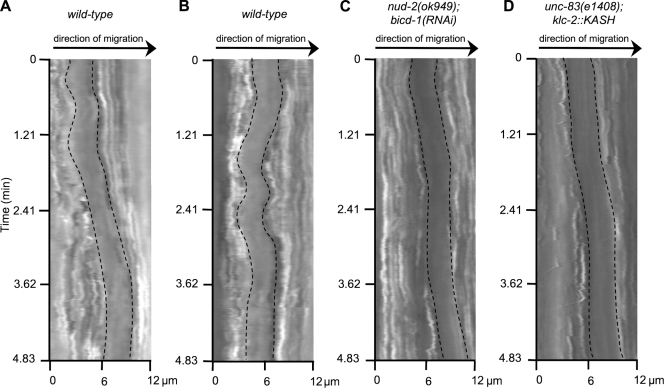
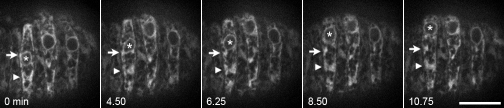
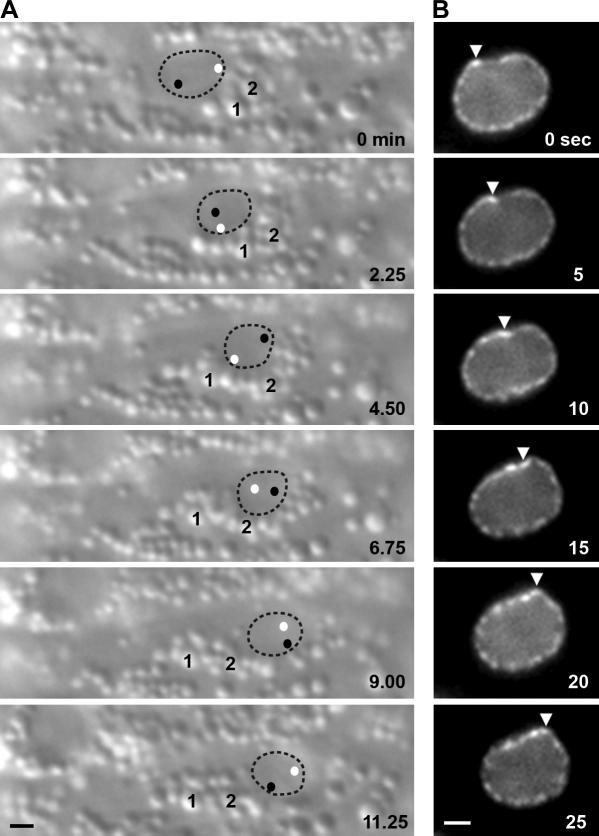
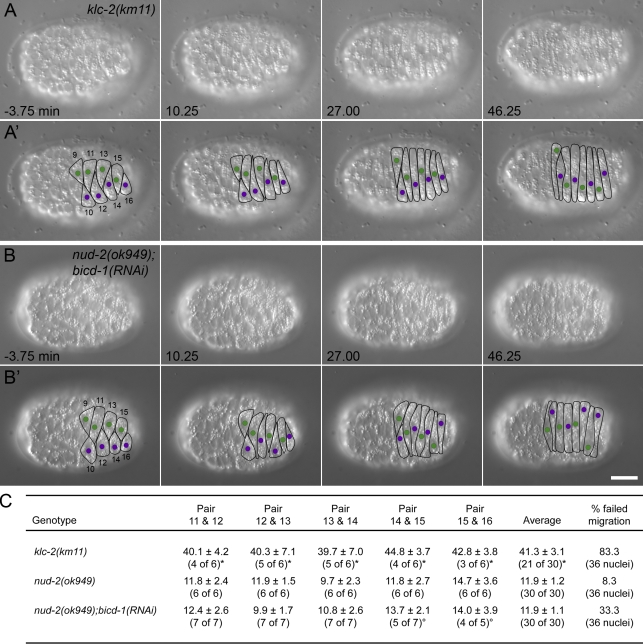
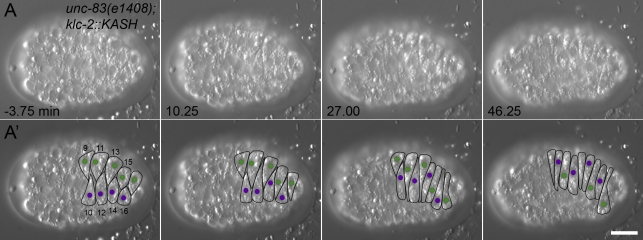
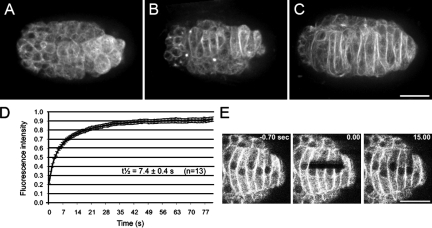
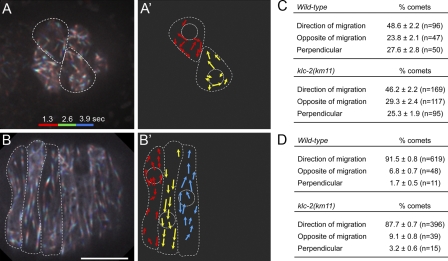
Kinesin-1 and dynein are recruited to the nuclear envelope by the Caenorhabditis elegans klarsicht/ANC-1/Syne homology (KASH) protein UNC-83 to move nuclei. The mechanisms of how these motors are coordinated to mediate nuclear migration are unknown. Time-lapse differential interference contrast and fluorescence imaging of embryonic hypodermal nuclear migration events were used to characterize the kinetics of nuclear migration and determine microtubule dynamics and polarity. Wild-type nuclei display bidirectional movements during migration and are also able to roll past cytoplasmic granules. unc-83, unc-84, and kinesin-1 mutants have severe nuclear migration defects. Without dynein, nuclear migration initiates normally but lacks bidirectional movement and shows defects in nuclear rolling, implicating dynein in resolution of cytoplasmic roadblocks. Microtubules are highly dynamic during nuclear migration. EB1::green fluorescence protein imaging demonstrates that microtubules are polarized in the direction of nuclear migration. This organization of microtubules fits with our model that kinesin-1 moves nuclei forward and dynein functions to move nuclei backward for short stretches to bypass cellular roadblocks.


Figures

Figure 1.
Figure 1.
UNC-83 and UNC-84 are required at the onset of nuclear migration. (A and B) DIC images from a representative time-lapse sequence of wild-type (A) and unc-83(e1408) (B) nuclear migration in hyp7 precursors. t = 0 min when the tip of cell 12 reached the opposite seam cell boundary. Dorsal view, anterior is to the left. (A’ and B’) Cell borders are outlined in black, nuclei migrating left to right are purple, and nuclei migrating right to left are green. Hyp7 cells are numbered 9–16, beginning with the posterior pointer cells. Bar, 10 µm. (C) Quantification of side by side nuclear alignment. Ratios represent the number of nuclei that could be scored out of total nuclei. Times are shown in minutes. Many mutant nuclei failed to reach the dorsal midline before filming stopped at least 40 min after intercalation (*). The final column shows the percentage of nuclei that failed to complete migration. (D and E) Lamin::GFP from wild-type (D) and unc-83(e1408) (E) time-lapse imaging. The image of lamin::GFP pseudocolored red was taken 60 s before the image in green. Bar, 1 µm.
Figure 2.
Figure 2.
Nuclei make relatively fast movements and bidirectional movements. Kymographs of nuclei made from DIC time-lapse imaging at 200-ms intervals. Edges of the nucleus are outlined. (A) Example of brief, faster nuclear movement in wild type. (B) Example of wild-type nuclear movements backward and forward during migration. (C) Example of normal forward migration, including a rapid run forward, of a nud-2(ok949);bicd-1(RNAi) nucleus. (D) Example of a rapid forward run of an unc-83(e1408);klc-2::KASH nucleus. The x axis is the distance traveled in micrometers. The forward direction of nuclear migration is left to right.
Figure 3.
Figure 3.
ER morphology during nuclear migration. Images of SP-12::GFP from a time-lapse sequence. Large sections of the ER behind the nucleus (*) are stretched but otherwise remain fairly stationary during migration (arrowheads). ER closer to the nucleus is briefly pulled along before detaching (arrows). Anterior is to the left, nuclear migration is up. Bar, 10 µm.
Figure 4.
Figure 4.
Actively migrating nuclei roll. (A) DIC images from a time-lapse sequence of nuclear rolling. Nuclear migration is to the right, and rolling is clockwise. The nucleus is outlined; black and white dots represent the position of nucleoli within the nucleus. Two cytoplasmic vesicles (1 and 2) are marked. (B) Images of lamin::GFP from a time-lapse sequence. Rolling is led by a deformation in the lamina (arrowheads). Nuclear migration is to the left, and rolling is clockwise. Bar, 1 µm.
Figure 5.
Figure 5.
Nuclear migration in kinesin-1 and dynein-regulatory mutant hyp7 precursors. (A and B) DIC images from a representative time-lapse sequence of klc-2(km11) (A) and nud-2(ok949);bicd-1(RNAi) (B) nuclear migration events. t = 0 min when the tip of cell 12 reached the opposite seam cell boundary. Anterior is to the left. (A’ and B’) Cell borders are outlined in black, nuclei migrating left to right are purple, and nuclei migrating right to left are green. Hyp7 cells are numbered 9–16, beginning with the posterior pointer cells. Bar, 10 µm. (C) Quantification of side by side nuclear alignment. Ratios represent the number of nuclei that could be scored out of total nuclei. Times are shown in minutes. Some nuclei failed to reach the dorsal midline before filming stopped at least 40 min after intercalation (*), and others could not be seen (°). The final column shows the percentage of nuclei that failed to complete migration.
Figure 6.
Figure 6.
Nuclear migration in unc-83(e1408);klc-2::KASH hyp7 precursors. (A) DIC images from a representative time-lapse sequence of unc-83(e1408);klc-2::KASH nuclear migration events. t = 0 min when the tip of cell 12 reached the opposite seam cell boundary. Anterior is to the left. (A’) Cell borders are outlined in black, nuclei migrating left to right are purple, and nuclei migrating right to left are green. Hyp7 cells are numbered 9–16, beginning with the posterior pointer cells. Bar, 10 µm.
Figure 7.
Figure 7.
Microtubules are dynamic in hyp7 precursors. (A–C) Representative images of GFP::β-tubulin from time-lapse sequences during intercalation and nuclear migration. Anterior is to the left. (A) Microtubules are a meshwork early in intercalation. (B) As cells intercalate, microtubules reorganize into parallel bundles. (C) During nuclear migration, most microtubules are in long bundles that appear dense at cell–cell boundaries. (D) FRAP curves from GFP::β-tubulin embryos. (E) Images of GFP::β-tubulin from a representative FRAP experiment. Bars, 10 µm.
Figure 8.
Figure 8.
Microtubules polarize in the direction of nuclear migration. (A and B) Images representing 3.9 s of EBP-1::GFP time-lapse sequences. The first 1.3 s are colored red, the next 1.3 s are colored green, and the last 1.3 s are colored blue to show directionality. Cell borders are outlined in white. Anterior is to the left. (A) Cells early in intercalation. (B) Cells with migrating nuclei. The nucleus in the left-most cell is migrating up, and direction alternates in every cell to the posterior. (A’ and B’) Cartoon representing direction of microtubule growth based on data in A and B. Nuclei and cell boundaries are outlined in white. (C and D) Quantification of the direction of microtubule growth by visualization of EBP-1::GFP comets early in intercalation (C) and during nuclear migration (D) for wild-type and klc-2(km11). Bars, 10 µm.
Figure 9.
Figure 9.
γ-Tubulin localizes at cell–cell boundaries. (A and B) Immunostaining of anti–γ-tubulin in fixed wild-type embryos (left), costained with DAPI to visualize nuclei (middle), and merged (right). Dorsal view, anterior is to the left. (A) During nuclear migration, γ-tubulin localizes to hyp7 cell–cell boundaries. (B) In earlier embryos, γ-tubulin localizes primarily to centrosomes. Bar, 10 µm.

Similar articles

Cited by

References

    1. Ally S., Larson A.G., Barlan K., Rice S.E., Gelfand V.I. 2009. Opposite-polarity motors activate one another to trigger cargo transport in live cells. J. Cell Biol. 187:1071–1082 10.1083/jcb.200908075 - DOI - PMC - PubMed
    1. Brenner S. 1974. The genetics of Caenorhabditis elegans. Genetics. 77:71–94 - PMC - PubMed
    1. Burke B., Roux K.J. 2009. Nuclei take a position: managing nuclear location. Dev. Cell. 17:587–597 10.1016/j.devcel.2009.10.018 - DOI - PubMed
    1. Cheerambathur D.K., Civelekoglu-Scholey G., Brust-Mascher I., Sommi P., Mogilner A., Scholey J.M. 2007. Quantitative analysis of an anaphase B switch: predicted role for a microtubule catastrophe gradient. J. Cell Biol. 177:995–1004 10.1083/jcb.200611113 - DOI - PMC - PubMed
    1. Chikashige Y., Tsutsumi C., Yamane M., Okamasa K., Haraguchi T., Hiraoka Y. 2006. Meiotic proteins bqt1 and bqt2 tether telomeres to form the bouquet arrangement of chromosomes. Cell. 125:59–69 10.1016/j.cell.2006.01.048 - DOI - PubMed

Publication types

MeSH terms