. 2010 Oct 4;191(1):199-210.
doi: 10.1083/jcb.201006116.

Distinct structural rearrangements of the VSV glycoprotein drive membrane fusion

Affiliations

Distinct structural rearrangements of the VSV glycoprotein drive membrane fusion

Sonia Libersou et al. J Cell Biol. .

Abstract

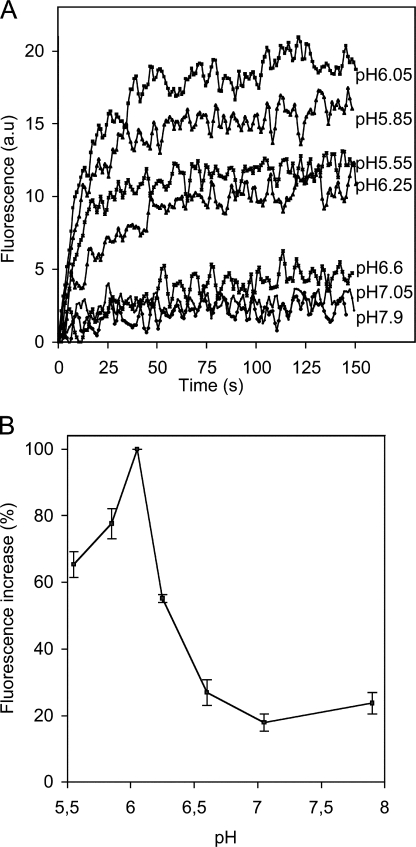
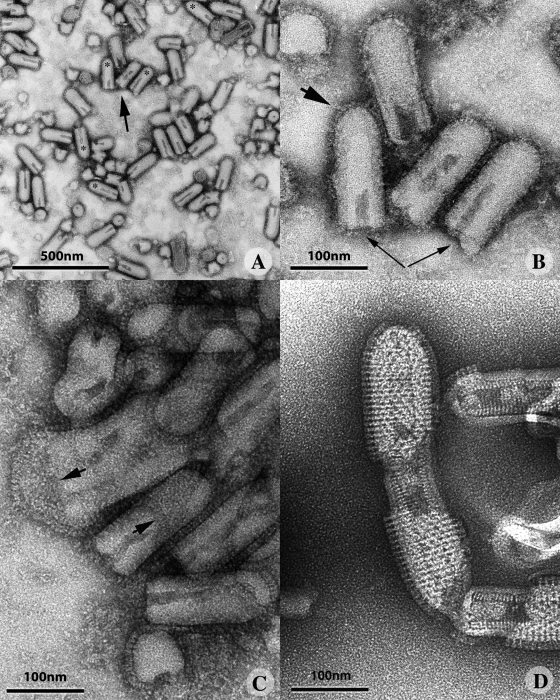
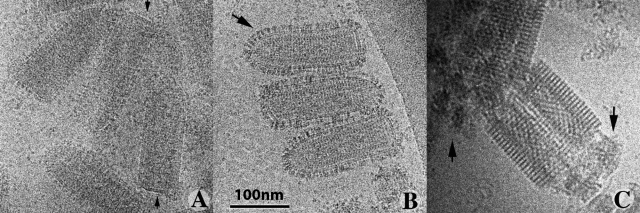
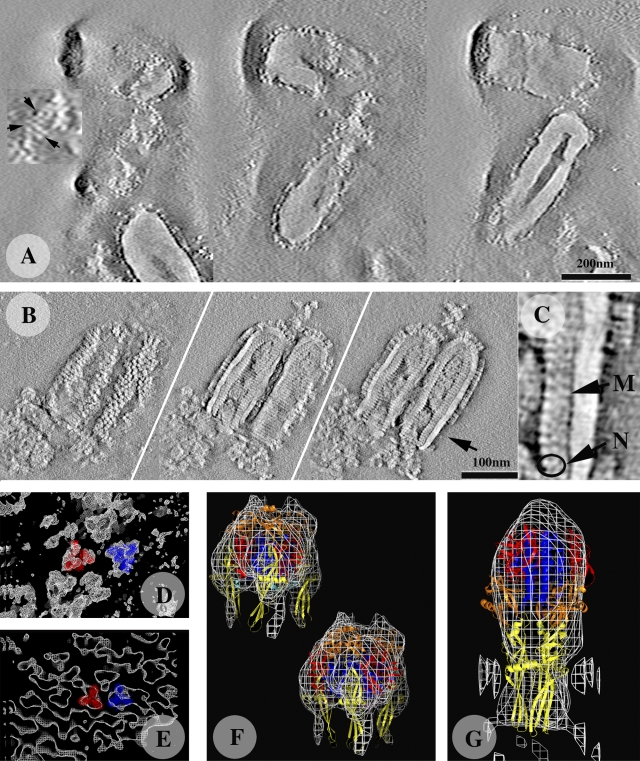
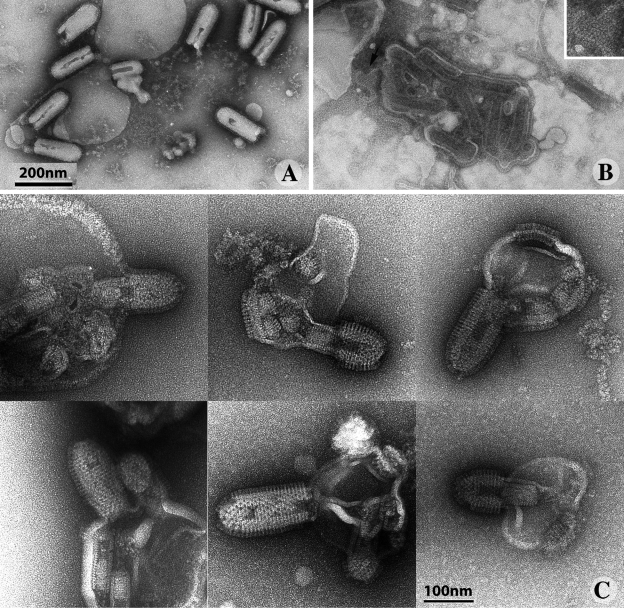
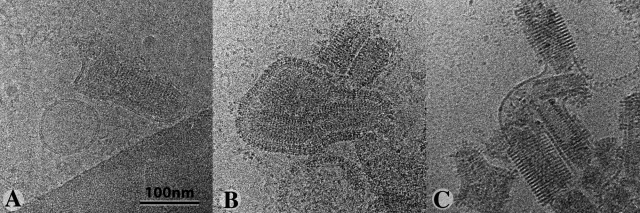
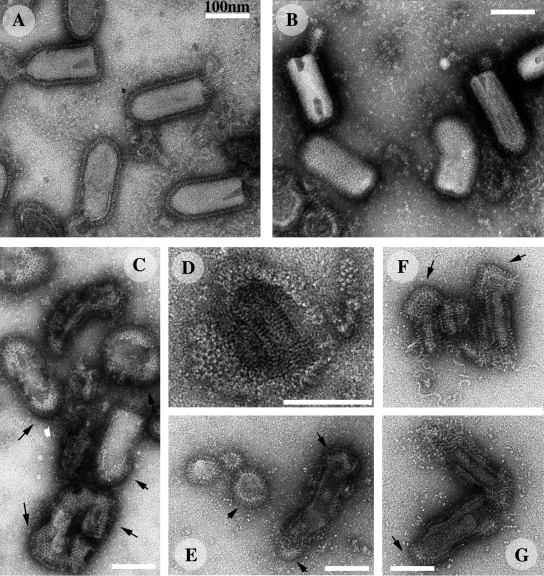
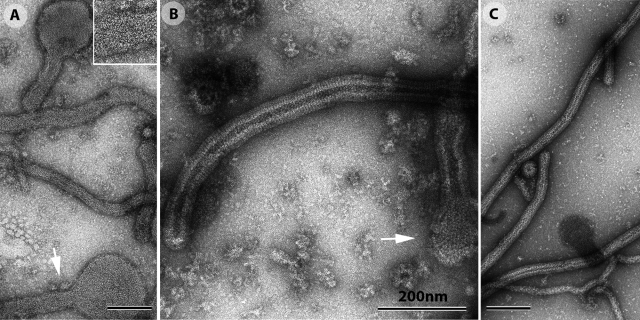
The entry of enveloped viruses into cells requires the fusion of viral and cellular membranes, driven by conformational changes in viral glycoproteins. Many studies have shown that fusion involves the cooperative action of a large number of these glycoproteins, but the underlying mechanisms are unknown. We used electron microscopy and tomography to study the low pH-induced fusion reaction catalyzed by vesicular stomatitis virus glycoprotein (G). Pre- and post-fusion crystal structures were observed on virions at high and low pH, respectively. Individual fusion events with liposomes were also visualized. Fusion appears to be driven by two successive structural rearrangements of G at different sites on the virion. Fusion is initiated at the flat base of the particle. Glycoproteins located outside the contact zone between virions and liposomes then reorganize into regular arrays. We suggest that the formation of these arrays, which have been shown to be an intrinsic property of the G ectodomain, induces membrane constraints, achieving the fusion reaction.


Figures

Figure 1.
Figure 1.
pH dependence of fusion between VSV and liposomes. (A) Kinetics of VSV fusion at various pH values, at 20°C, a.u. (arbitrary units). (B) pH dependence of the extent of fusion at 20°C, obtained from kinetic curves, such as those shown in A. The increase in fluorescence was maximal at pH 6.05, and this value was defined as 100%. The slight increase in fluorescence observed at pH values above 6.5 is due to virus–membrane interactions rather than membrane fusion. Error bars indicate the standard deviation (for three experiments).
Figure 2.
Figure 2.
Morphology of negatively stained VSV at pH 7.5, 6.0, and 5.5. (A) At pH 7.5, VSV formed a monodisperse suspension with virions that were bullet shaped when viewed from the side and circular when viewed from above. The asterisks indicate viruses with a base depleted of glycoproteins. (B) Higher magnification of the virions indicated by an arrow in A. Continuous layer of G over the surface of the virus (large arrow), with a lower density at the base of the particle (thin arrows). The right arrow indicates a virus with no spikes visible at its base. (C) VSV forms large aggregates at pH 6.0. G has a more elongated structure, making it possible to distinguish individual spikes, which are often closely packed at the apex of the viral particle (arrows). (D) At pH 5.5, the spikes form ordered helical arrays. Note that the viral particles fuse at their bases. The nucleocapsid is now clearly visible, indicating that the stain penetrated the viral particle.
Figure 3.
Figure 3.
Morphology of VSV embedded in vitreous ice. (A) At pH 7.5, G forms a thin continuous layer around the viral particle. The arrows indicate viruses with no G visible at their base. (B) At pH 6, G elongates and individual spikes protruding from the membrane are visible. The arrow indicates an area in which the spikes are regularly organized. (C) At pH 5.5, all the spikes display a well-ordered helical organization. Note that the membrane at the base of the particle is disrupted, allowing the release of internal material (indicated by arrows). In A and B, the image is underfocused by ∼1.8 µm. In C, it is underfocused by 3 µm, to improve visualization of the helical G array.
Figure 4.
Figure 4.
Tomography of negatively stained VSV incubated at pH 7.5 and 5.5, and comparison of the structure of G with the corresponding x-ray crystallography model. (A and B) Three sections of the tomograms are shown (extracted from Videos 1 and 3); one at the level of the G layer (left), one at the level of the nucleocapsid (middle) and one passing through the center of the particle (right). The tilted series used to calculate the tomograms were recorded on negatively stained samples. (A) At pH 7.5, VSV is bullet shaped, with a central cavity. In some areas, the G layer contains trimeric entities (arrows in the enlargement). As the stain does not penetrate the viral particle, the nucleocapsids are not visible. (B) At pH 5.5, G shows trimeric structures that form quasi-helical arrays (left). The nucleocapsid is now visible (middle and right). In the center of the particle, a twisted material occupies the central cavity. (C) Enlargement of the central section (indicated by the arrow in the right frame in B) showing the organization of the particle beneath the membrane. The characteristic bilobed shape of N is visible and an additional domain is seen that may be attributed to M (Ge et al., 2010). (D and E) Volumes at the surface of the particle, extracted from the tomograms, revealing the presence of trimeric entities to which x-ray models of the pre-fusion (D) and post-fusion (E) structures can be manually fitted. In each case, two models (in blue and red) are displayed. (F and G) For a more quantitative fit, four trimers were isolated from the reconstructions and averaged. The x-ray models were fitted to the resulting averaged 3D reconstructions with UROX (Siebert and Navaza, unpublished program), a more user-friendly version of URO (Navaza et al., 2002). (F) For viruses incubated at pH 7.5, two fits are shown. For the fit displayed above and to the left, the crystallographic trimer, with its domains shown in color, was directly fitted in the electron microscopy reconstruction. The second fit (below and to the right) was performed with a monomer, imposing C3 symmetry. The better fit obtained with this model suggests that the trimer of G at the surface of the particle is slightly different from that in the crystalline structure. (G) At pH 5.5, the crystalline post-fusion model of G fits the tomographic model well.
Figure 5.
Figure 5.
Visualization of individual fusion events between VSV and liposomes at low pH, after negative staining. (A) At pH 7.5, some viral particles interact with liposomes, but no fusion is detected. (B) At pH 6.0, viral particles and liposomes aggregate and numerous fusion events are visible. Fusion events are characterized by the presence of several nucleocapsids within a liposome, the membrane of which contains glycoproteins in the post-fusion conformation, often clustered into locally ordered arrays (arrow; magnified inset). (C) At pH 5.5 individual fusion events can be seen, demonstrating that fusion occurs at the base of the virion and that spikes located on the cylindrical part of the virus form ordered helical arrays.
Figure 6.
Figure 6.
Visualization of individual fusion events between VSV and liposomes at low pH, in amorphous ice. (A) At pH 7.5, viral particles and liposomes do not fuse. (B) At pH 6.0, G shows the characteristic post-fusion conformation and numerous fusion events are observed. (C) At pH 5.5, individual fusion events can be seen. Fusion proceeds from the base of the virus, and G forms helical arrays on the cylindrical part of the viral particle.
Figure 7.
Figure 7.
Gradual pH decrease minimizes virion aggregation, making it possible to observe individual VSV particles. (A) After incubation for 15 min at pH 6.6 and 37°C, virions are not aggregated and most of the spikes are in their post-fusion conformation (ectodomain length of 12 nm). (B) The viral preparation shown in A was subsequently incubated at pH 6.0 and 20°C for 20 min. All the spikes are in their post-fusion conformation and the virions have retained their initial shape. The arrow indicates a virion with its surface completely covered by spikes in their post-fusion conformation. (C–G) The viral preparation shown in A was subsequently incubated at pH 5.5 and 20°C for 20 min. Most of the particles are disrupted. Extensive lattices of G are visible at the surface of the virion (arrows in C, disrupted virion in D). In many cases (E–G) the particles are highly damaged, precluding the observation of large regular networks of G. Nevertheless, local regular arrays are still observed (arrows). In all frames, the bars indicate 100 nm.
Figure 8.
Figure 8.
The incubation of Gth with liposomes at low pH induces the formation of tubular structures. (A) At pH 6, Gth, inserted into liposomes that were initially spherical, forms a local network (indicated by the arrow and enlarged in the top right frame), favoring the formation of tubular structures. (B) At pH 5.5, Gth forms more extensive, regular arrays at the surface of liposomes, resembling those formed by G at the surface of the virus. Spherical vesicles are nevertheless still visible (arrow). (C) At pH 5.2, only rigid tubular protein–lipid structures are observed, at the surface of which Gth displays quasi-helical symmetry. All the samples were negatively stained for electron microscopy observation.

Similar articles

Cited by

References

    1. Albertini A.A., Wernimont A.K., Muziol T., Ravelli R.B., Clapier C.R., Schoehn G., Weissenhorn W., Ruigrok R.W. 2006. Crystal structure of the rabies virus nucleoprotein-RNA complex. Science. 313:360–363 10.1126/science.1125280 - DOI - PubMed
    1. Backovic M., Jardetzky T.S. 2009. Class III viral membrane fusion proteins. Curr. Opin. Struct. Biol. 19:189–196 10.1016/j.sbi.2009.02.012 - DOI - PMC - PubMed
    1. Barge A., Gaudin Y., Coulon P., Ruigrok R.W. 1993. Vesicular stomatitis virus M protein may be inside the ribonucleocapsid coil. J. Virol. 67:7246–7253 - PMC - PubMed
    1. Blumenthal R., Sarkar D.P., Durell S., Howard D.E., Morris S.J. 1996. Dilation of the influenza hemagglutinin fusion pore revealed by the kinetics of individual cell-cell fusion events. J. Cell Biol. 135:63–71 10.1083/jcb.135.1.63 - DOI - PMC - PubMed
    1. Brown J.C., Newcomb W.W., Lawrenz-Smith S. 1988. pH-dependent accumulation of the vesicular stomatitis virus glycoprotein at the ends of intact virions. Virology. 167:625–629 - PubMed

Publication types

MeSH terms