

Hyperoxia blunts counterregulation during hypoglycaemia in humans: possible role for the carotid bodies?
- PMID: 20921201
- PMCID: PMC3008860
- DOI: 10.1113/jphysiol.2010.197491
Hyperoxia blunts counterregulation during hypoglycaemia in humans: possible role for the carotid bodies?
Erratum in
- J Physiol. 2011 Feb 15;589(Pt 4):999
Abstract
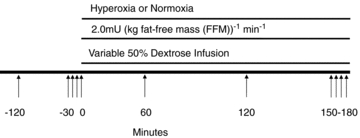
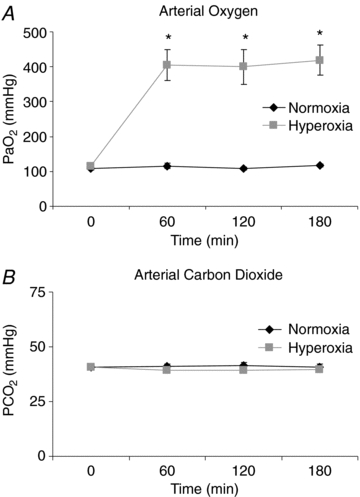
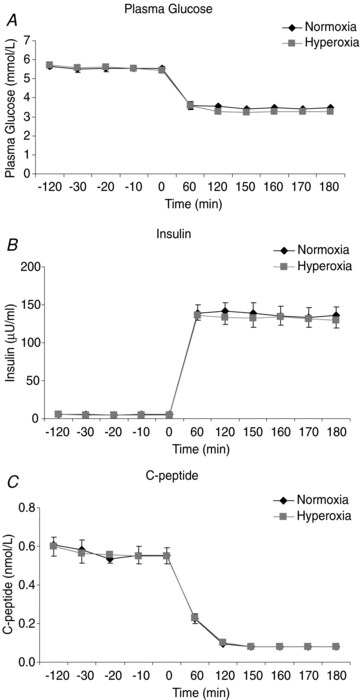
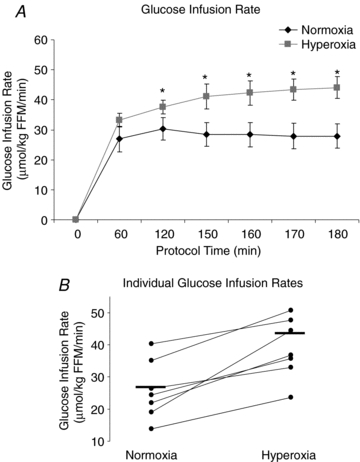
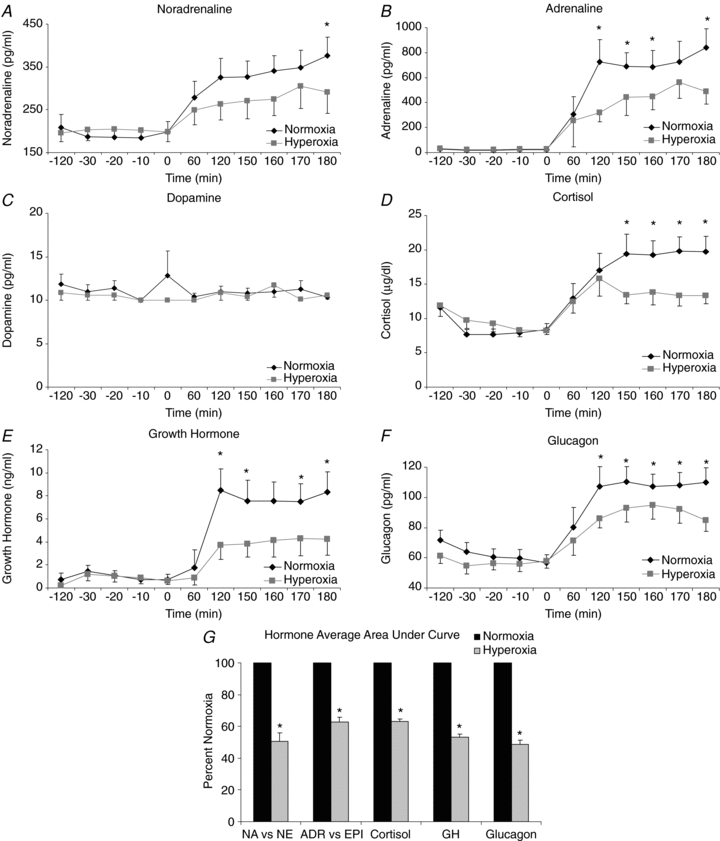
Chemoreceptors in the carotid bodies sense arterial oxygen tension and regulate respiration. Isolated carotid body glomus cells also sense glucose, and animal studies have shown the carotid bodies play a role in the counterregulatory response to hypoglycaemia. Thus, we hypothesized that glucose infusion rate would be augmented and neuro-hormonal counterregulation blunted during hypoglycaemia when the carotid bodies were desensitized by hyperoxia. Seven healthy adults (four male, three female) underwent two 180 min hyperinsulinaemic (2 mU (kg fat-free mass (FFM))(-1) min(-1)), hypoglycaemic (3.33 mmol l(-1)) clamps 1 week apart, randomized to either normoxia (arterial P(O2) (P(aO2)) 111 ± 6.3 mmHg) or hyperoxia (P(aO2) 345 ± 80.6 mmHg) (P < 0.05). Plasma glucose concentrations were similar during normoxia and hyperoxia at baseline (5.52 ± 0.15 vs. 5.55 ± 0.13 μmol ml(-1)) and during the clamp (3.4 ± 0.05 vs. 3.3 ± 0.05 μmol ml(-1)). The glucose infusion rate was 44.2 ± 3.5% higher (P < 0.01) during hyperoxia than normoxia at steady state during the clamp (28.2 ± 0.15 vs. 42.7 ± 0.65 μmol (kg FFM)(-1) min(-1); P < 0.01). Area under the curve values (expressed as percentage normoxia response) for counterregulatory hormones during hypoglycaemia were significantly suppressed by hyperoxia (noradrenaline 50.7 ± 5.2%, adrenaline 62.6 ± 3.3%, cortisol 63.2 ± 2.1%, growth hormone 53.1 ± 2.7%, glucagon 48.6 ± 2.1%, all P < 0.05 vs. normoxia). These data support the idea that the carotid bodies respond to glucose and play a role in the counterregulatory response to hypoglycaemia in humans.
Figures
Comment in
-
Hyperoxia blunts counterregulation in humans and differential control of the sympathetic nervous system.J Physiol. 2011 Mar 1;589(Pt 5):1235; author reply 1237-8. doi: 10.1113/jphysiol.2010.203588. J Physiol. 2011. PMID: 21486822 Free PMC article. No abstract available.
References
-
- Al-Waili NS, Butler GJ, Beale J, Abdullah MS, Finkelstein M, Merrow M, Rivera R, Petrillo R, Carrey Z, Lee B, Allen M. Influences of hyperbaric oxygen on blood pressure, heart rate and blood glucose levels in patients with diabetes mellitus and hypertension. Arch Med Res. 2006;37:991–997. - PubMed
-
- Alvarez-Buylla R, Alvarez-Buylla E, Mendoza H, Montero SA, Alvarez-Buylla A. Pituitary and adrenals are required for hyperglycemic reflex initiated by stimulation of CBR with cyanide. Am J Physiol Regul Integr Comp Physiol. 1997;272:R392–399. - PubMed
-
- Czupryniak L, Loba J, Pawlowski M, Nowak D, Bialasiewicz P. Treatment with continuous positive airway pressure may affect blood glucose levels in nondiabetic patients with obstructive sleep apnea syndrome. Sleep. 2005;28:601–603. - PubMed
Publication types
MeSH terms
Grants and funding
- 1 UL1 RR024150/RR/NCRR NIH HHS/United States
- R01 DK029953/DK/NIDDK NIH HHS/United States
- DK 082424/DK/NIDDK NIH HHS/United States
- F32 DK84624-01A1/DK/NIDDK NIH HHS/United States
- DK29953/DK/NIDDK NIH HHS/United States
- T32 DK07352/DK/NIDDK NIH HHS/United States
- F32 DK084624/DK/NIDDK NIH HHS/United States
- UL1 RR024150/RR/NCRR NIH HHS/United States
- K23 DK082424/DK/NIDDK NIH HHS/United States
- R01 DK090541/DK/NIDDK NIH HHS/United States
- N01 NS032352/NS/NINDS NIH HHS/United States
- R37 DK029953/DK/NIDDK NIH HHS/United States
- T32 DK007352/DK/NIDDK NIH HHS/United States
LinkOut - more resources
Full Text Sources
Other Literature Sources
Medical
Research Materials
Miscellaneous