. 2010 Dec 10;285(50):39366-79.
doi: 10.1074/jbc.M110.133470. Epub 2010 Oct 4.

Deceleration of the E1P-E2P transition and ion transport by mutation of potentially salt bridge-forming residues Lys-791 and Glu-820 in gastric H+/K+-ATPase

Affiliations

Deceleration of the E1P-E2P transition and ion transport by mutation of potentially salt bridge-forming residues Lys-791 and Glu-820 in gastric H+/K+-ATPase

Katharina L Dürr et al. J Biol Chem. .

Abstract

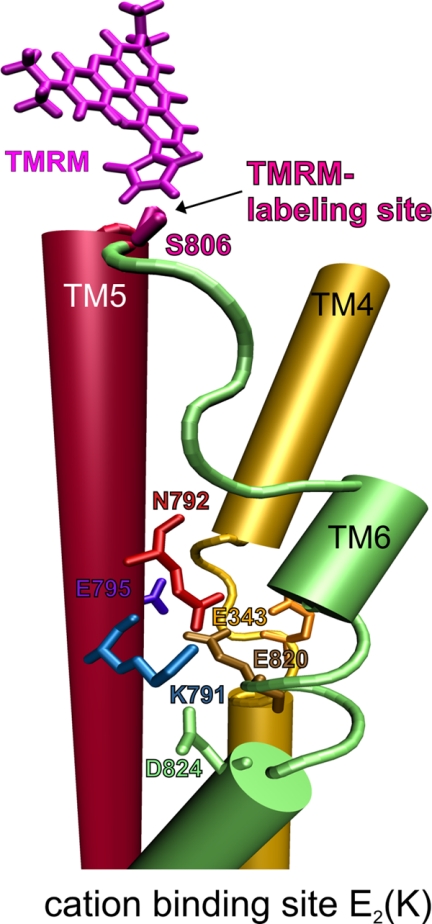
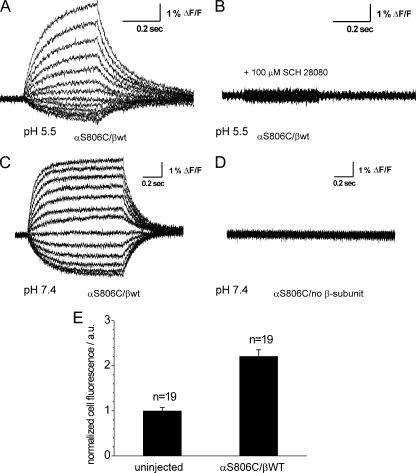
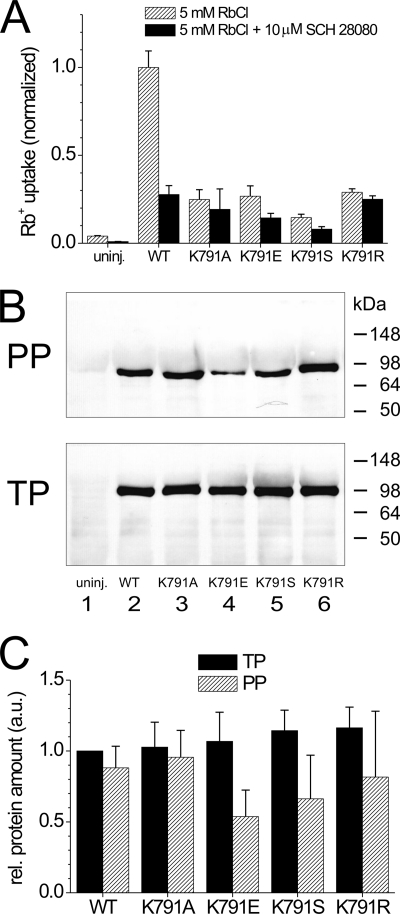
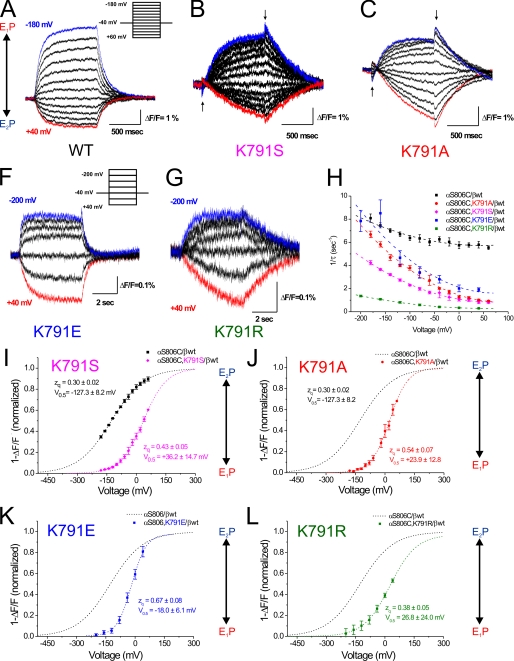
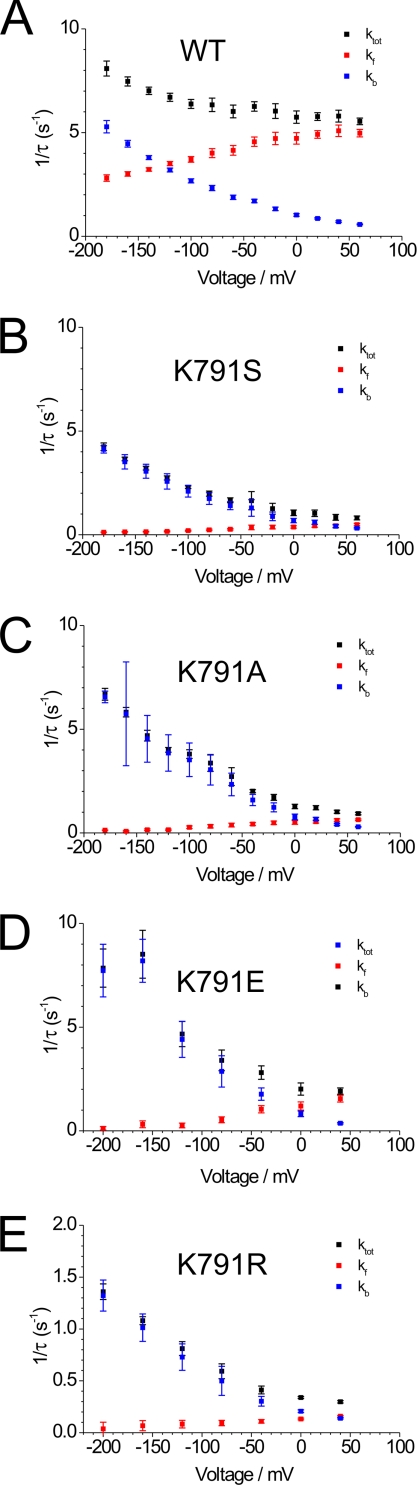
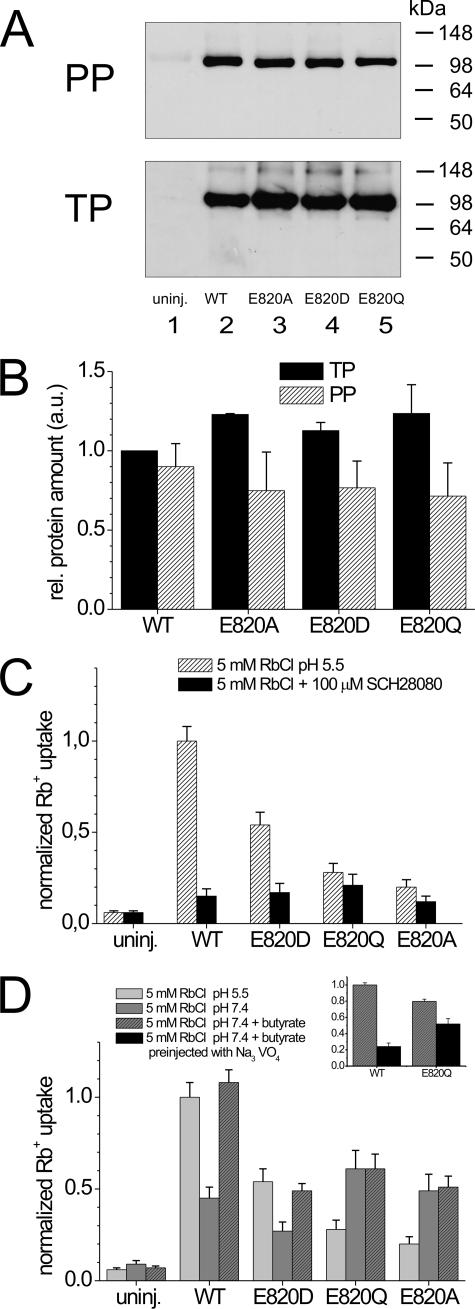
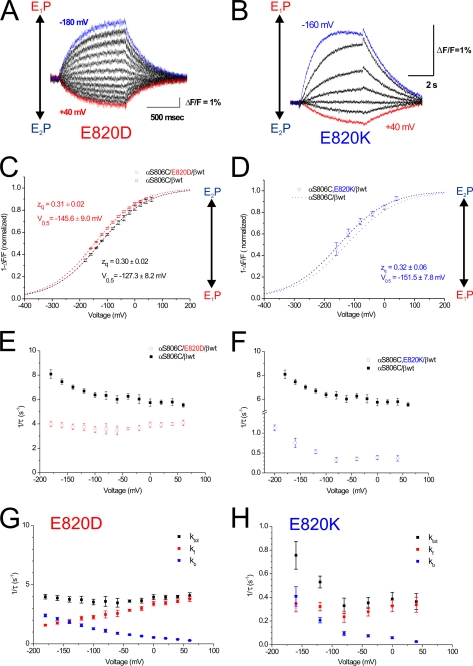
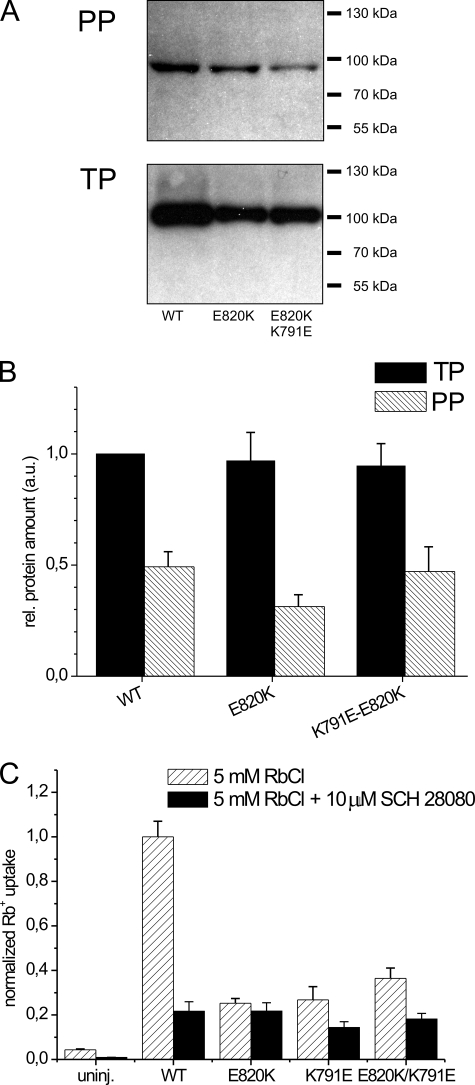
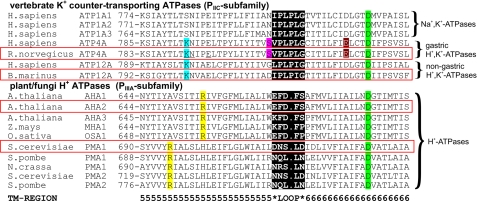
A lysine residue within the highly conserved center of the fifth transmembrane segment in P(IIC)-type ATPase α-subunits is uniquely found in H,K-ATPases instead of a serine in all Na,K-ATPase isoforms. Because previous studies suggested a prominent role of this residue in determining the electrogenicity of non-gastric H,K-ATPase and in pK(a) modulation of the proton-translocating residues in the gastric H,K-ATPases as well, we investigated its functional significance for ion transport by expressing several Lys-791 variants of the gastric H,K-ATPase in Xenopus oocytes. Although the mutant proteins were all detected at the cell surface, none of the investigated mutants displayed any measurable K(+)-induced stationary currents. In Rb(+) uptake measurements, replacement of Lys-791 by Arg, Ala, Ser, and Glu substantially impaired transport activity and reduced the sensitivity toward the E(2)-specific inhibitor SCH28080. Furthermore, voltage clamp fluorometry using a reporter site in the TM5/TM6 loop for labeling with tetra-methylrhodamine-6-maleimide revealed markedly changed fluorescence signals. All four investigated mutants exhibited a strong shift toward the E(1)P state, in agreement with their reduced SCH28080 sensitivity, and an about 5-10-fold decreased forward rate constant of the E(1)P ↔ E(2)P conformational transition, thus explaining the E(1)P shift and the reduced Rb(+) transport activity. When Glu-820 in TM6 adjacent to Lys-791 was replaced by non-charged or positively charged amino acids, severe effects on fluorescence signals and Rb(+) transport were also observed, whereas substitution by aspartate was less disturbing. These results suggest that formation of an E(2)P-stabilizing interhelical salt bridge is essential to prevent futile proton exchange cycles of H(+) pumping P-type ATPases.


Figures

FIGURE 1.
FIGURE 1.
Location of Lys-791 and Glu-820 in the putative cation binding pocket of gastric H,K-ATPase and of the reporter site Ser-806 in the TM5/TM6 loop used for TMRM labeling. Shown is a homology model of the cation binding pocket of rat gastric H,K-ATPase based on the Na,K-ATPase crystal structure in the K+ occluded E2-state (PDB code 3B8E). Selected residues in TM4, TM5 and TM6 (yellow, red, and green cylinders) involved in cation coordination of the gastric H,K-ATPase are represented as colored sticks. Lys-791, which was mutated in the present study, is shown in blue; Glu-820, which potentially forms an E2-specific salt bridge with Lys-791, is illustrated in brown. The reporter site S806C in the TM5/TM6 loop used for labeling with TMRM (in magenta) is also indicated (in pink).
FIGURE 2.
FIGURE 2.
Control measurements on TMRM-labeled oocytes expressing construct αS806C, demonstrating the specificity of the voltage-jump induced fluorescence changes. A–D, shown are fluorescence signals of TMRM-labeled oocytes in response to voltage jumps from a holding potential of −40 mV to values between −180 and +60 mV in 20-mV increments. A and B, shown are fluorescence signals of an individual oocyte expressing the αS806C construct together with the H,K-ATPase β-subunit before (A) and after (B) the addition of the specific inhibitor SCH28080 (100 μm). C and D, shown are voltage jump-induced fluorescence responses from two oocytes from the same batch, which were either injected with the cRNA of the αS806C construct alone (D) or co-injected with the H,K-ATPase β-subunit (C). E, shown is normalized cell fluorescence of TMRM-labeled oocytes, which were either uninjected or expressed the H,K-ATPase αS806C construct together with the wild-type β-subunit. Data were obtained from three batches of cells, and the fluorescence intensity was normalized to the mean fluorescence of uninjected oocytes in each batch. For the measurement of cellular fluorescence, all cells from each batch of oocytes were placed into the perfusion chamber of the experimental microscope and illuminated with constant excitation light intensity. A constant region of interest was chosen for all cells using a circular iris aperture that allowed measurement of the fluorescence of about 90% of the illuminated cell surface. a.u., arbitrary units.
FIGURE 3.
FIGURE 3.
Rb+ uptake and cell surface expression of Xenopus oocytes expressing H,K-ATPase wild-type or Lys-791 variants. A, H,K-ATPase-mediated Rb+ uptake at 5 mm RbCl in the absence (hatched bars) or presence (black bars) of 10 μm SCH28080 is shown. Results from uninjected control oocytes, oocytes injected with the reference construct HKαS806C/βwt, or constructs with the indicated Lys-791 point mutations are shown. Rb+ uptake was measured on individual cells by atomic absorption spectrometry (see “Experimental Procedures”). Data are the means ± S.E. from two individual experiments with 15–20 oocytes, normalized to Rb+ uptake of the wild-type construct HKαS806C/βwt (corresponding to 20.2 and 38.9 pmol/oocyte/min, respectively). B, shown is Western blot analysis of plasma membrane (PP, upper panel) and total membrane fractions (TP, lower panel) isolated from H,K-ATPase-expressing oocytes. Detection used anti-H,Kα antibody HK12.18. One representative Western blot is shown. C, densitometric analysis is shown of Western blot bands from corresponding total membrane or plasma membrane fraction preparations as shown in B, normalized to the band intensity of the TP fraction of the WT protein. Data are expressed as the means ± S.D. from four to five experiments using oocytes from different Xenopus females. a.u., arbitrary units.
FIGURE 4.
FIGURE 4.
Voltage dependence of the E1P/E2P distribution and kinetics of E1P ↔ E2P transitions of H,K-ATPase Lys-791 mutants studied by voltage clamp fluorometry. A–G, shown are fluorescence responses of site-specific labeled gastric H,K-ATPase under K+-free conditions (90 mm NaCl, pH 5.5) upon voltage jumps from a holding potential of −40 mV to voltages between −180 mV and +60 mV (A and F insets = voltage protocols). Recordings originated from single oocytes coexpressing the wild-type β-subunit with either the reference construct HKαS806C (A) or the indicated Lys-791 variant constructs (B–G). H, shown are reciprocal time constants from monoexponential fits to voltage jump-induced fluorescence changes under K+-free conditions for H,K-ATPase α(S806C,K791S)/βwt (pink diamonds), α(S806C,K791A)/βwt (red circles), α(S806C,K791E)/βwt (blue squares), or α(S806C,K791R)/βwt (green squares) in comparison to αS806C/βwt (black squares). Data are the means ± S.E. from 5–17 oocytes. I–L, voltage dependence of fluorescence amplitudes (1 − ΔF/F) under K+-free conditions for the indicated Lys-791 mutants, each in comparison to αS806C/βwt (same colors as in H). Data are the means ± S.E. of 5–13 oocytes. A curve resulting from a fit of a Boltzmann function is superimposed together with the corresponding wild-type curve (dotted lines in J–L). The fluorescence amplitudes 1 − ΔF/F were normalized to saturation values from the fits. Midpoint potentials V0.5 and slope factors zq derived from the fits are also shown.
FIGURE 5.
FIGURE 5.
Calculated voltage dependence of the forward and reverse rate constants of the E1P ↔ E2P conformational transition for wild-type H,K-ATPase and several Lys-791 variants. Shown is calculated voltage dependence of the forward (kf) and reverse (kb) rate constant of the E1P-E2P conformational transition in comparison to the experimentally obtained reciprocal time constants (ktot) from voltage clamp fluorometric measurements (using the H,K-ATPase αS806C/βWT as a background) for the wild-type (A) and mutants K791S (B), K791A (C), K791E (D), and K791R (E). Values were calculated using a simple two-state kinetic model; see supplemental Appendix A for details.
FIGURE 6.
FIGURE 6.
Cell surface expression and Rb+ uptake of Xenopus oocytes expressing H,K-ATPase wild-type or several Glu-820 variants. A, shown is a Western blot analysis of plasma membrane (PP, upper panel) and total membrane fractions (TP, lower panel) isolated from H,K-ATPase-expressing oocytes. Detection used anti-H,Kα antibody HK12.18. One representative Western blot of at least three from different oocyte batches is shown. B, shown is a densitometric analysis of Western blot bands from corresponding total membrane or plasma membrane fraction preparations as shown in A, normalized to the band intensity of the TP fraction of the WT protein. Data are expressed as the means ± S.D. from 2–5 experiments. a.u., arbitrary units. C, H,K-ATPase-mediated Rb+ uptake at 5 mm RbCl in the absence (hatched bars) or presence of 100 μm SCH28080 (black bars) is shown. D, H,K-ATPase-mediated Rb+ uptake at 5 mm RbCl and pHex = 7.4 (dark gray bars), pHex = 5.5 (light gray bars), or at pHex = 7.4 in the presence of 40 mm butyrate, which causes a slight intracellular acidification (by ∼ 0.5 pH units, hatched dark gray bars), is shown. Results from uninjected control oocytes or oocytes injected with the reference construct HKαS806C/βwt or HKαS806C/E820X (X = Ala, Gln, Asp) are shown. Rb+ uptake was measured on individual cells by atomic absorption spectrometry (see “Experimental Procedures”). Data are the means ± S.E. from four individual experiments with 15–20 oocytes, normalized to Rb+ uptake of the wild-type construct HKαS806C/βwt (corresponding to 23.9, 22.5, 21.2, and 24.9 pmol/oocyte/min, respectively). Inset, shown is inhibition of Rb+ uptake by sodium orthovanadate for oocytes expressing either the wild-type or the E820Q mutant proton pump at 5 mm RbCl and pH 7.4 in presence of 40 mm butyrate (black bars, see “Experimental Procedures” for details). One representative experiment is shown.
FIGURE 7.
FIGURE 7.
Voltage dependence of the E1P/E2P distribution and kinetics of E1P/E2P transitions of H,K-ATPase mutants E820D and E820K. A and B, shown are fluorescence responses of site-specifically labeled gastric H,K-ATPase under K+-free conditions (90 mm NaCl, pH 5.5) upon voltage jumps from a holding potential of −40 mV to voltages between −180 and +60 mV (same voltage protocols as in Fig. 4, A and F). Recordings originated from a representative oocyte coexpressing the wild-type HKβ subunit with HKαS806C,E820D in A or HKαS806C,E820K in B, respectively. C and D, shown is voltage dependence of fluorescence amplitudes (1 − ΔF/F) under K+-free conditions for mutants HKαS806C,E820D (open red circle in C) and HKαS806C,E820K (open blue circle in D) compared with the reference construct HKαS806 (open square). Data are the means ± S.E. of 9–14 oocytes. A curve resulting from a fit of a Boltzmann function is superimposed. The fluorescence amplitudes 1 − ΔF/F were normalized to saturation values from the fits. Midpoint potentials V0.5 and slope factors zq derived from the fits are also shown. E and F, shown are reciprocal time constants from monoexponential fits to voltage jump-induced fluorescence changes under K+-free conditions for the mutants HKαS806C,E820D ((open red circle in E) and HKαS806C,E820K (open blue circle in F), each in comparison to αS806C (filled square). Data are means ± S.E. from 7–9 oocytes. G and H, shown is the calculated voltage dependence of the forward (kf) and reverse (kb) rate constant of the E1P-E2P conformational transition in comparison to the experimentally obtained reciprocal time constants (ktot) from voltage clamp fluorometric measurements for the mutants E820D (G) and E820K (H). Values were calculated using a simple two-state kinetic model; see supplemental Appendix A for details.
FIGURE 8.
FIGURE 8.
Cell surface expression and Rb+ uptake activity of the charge-inverting double mutation E820K/K791E compared with the wild-type and the single mutant E820K. A, shown is the Western blot analysis of plasma membrane (PP, upper panel) and total membrane fractions (TP, lower panel) isolated from oocytes co-expressing the wild-type H,K-ATPase β-subunit together with the indicated α-subunit constructs. Detection used anti-H,K α-antibody HK12.18. One representative Western blot of three similar ones is shown. B, Densitometric analysis is shown of Western blot bands from corresponding total membrane or plasma fraction (PP) preparations as shown in A, normalized to the band intensity of the TP fraction of the WT protein. Data are expressed as means ± S.D. from three experiments. a.u., absorbance units. C, shown is H,K-ATPase-mediated Rb+ uptake at 5 mm RbCl in the absence (hatched bars) or presence (black bars) of 100 μm SCH28080. Results from uninjected control oocytes, oocytes injected with the wild-type β-subunit, and either reference construct HKαS806C or HKαS806C-constructs with the indicated additional mutations are shown. Data are the means ± S.E. from two experiments with 15–20 oocytes, normalized to Rb+ uptake of the wild-type construct HKαS806C/βwt (corresponding to 14.4 and 29.8 pmol/oocyte/min, respectively). a.u., arbitrary units.
FIGURE 9.
FIGURE 9.
Alignment of TM5 and TM6 from P-type ATPases of the PIIC- and PIIIA-type subfamilies. Sequence alignments were adapted from Axelsen and Palmgren (60) and adjusted manually for comparison of PIIC- and PIIIA-type ATPases. The sequence of the rat gastric H,K-ATPase used for mutagenesis in the present study, and sequences from other P-type ATPases for which individual residues are explicitly discussed here are framed by red boxes. TM5/TM6 loops are underlaid in black, and charged residues that are involved in putative interhelical salt bridges between TM5 and TM6 are highlighted in different colors (color coding is analogous to Fig. 1). The position (αS806C) used for site-specific TMRM-labeling of the gastric H,K-ATPase is highlighted in magenta. Residues of the rat gastric H,K-ATPases that are shown in Fig. 1 are underscored.

Similar articles

Cited by

References

    1. Geering K. (2001) J. Bioenerg. Biomembr. 33, 425–438 - PubMed
    1. Thomas R. C. (1969) J. Physiol. 201, 495–514 - PMC - PubMed
    1. Sachs G., Chang H. H., Rabon E., Schackman R., Lewin M., Saccomani G. (1976) J. Biol. Chem. 251, 7690–7698 - PubMed
    1. Burnay M., Crambert G., Kharoubi-Hess S., Geering K., Horisberger J. D. (2001) Am. J. Physiol. Renal. Physiol. 281, F869–F874 - PubMed
    1. van der Hijden H. T., Grell E., de Pont J. J., Bamberg E. (1990) J. Membr. Biol. 114, 245–256 - PubMed

Publication types

LinkOut - more resources