. 2010 Dec;16(12):2414-26.
doi: 10.1261/rna.1829110. Epub 2010 Oct 4.

Long-range tertiary interactions in single hammerhead ribozymes bias motional sampling toward catalytically active conformations

Affiliations

Long-range tertiary interactions in single hammerhead ribozymes bias motional sampling toward catalytically active conformations

S Elizabeth McDowell et al. RNA. 2010 Dec.

Abstract

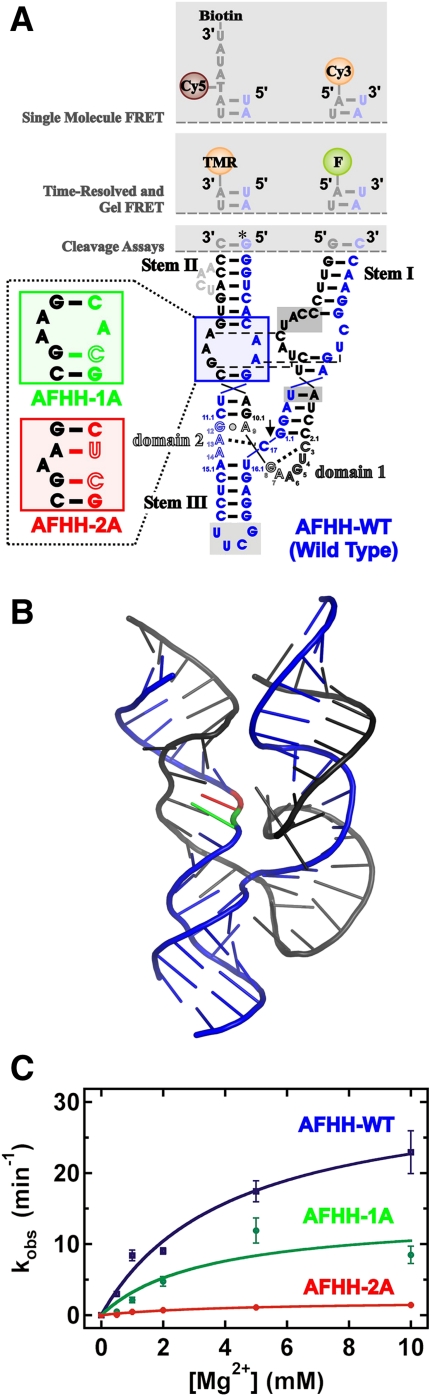
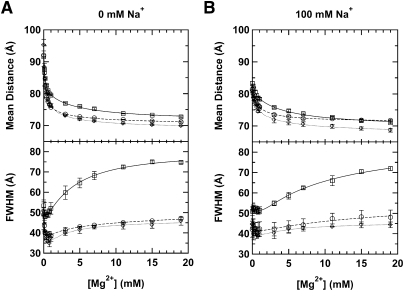
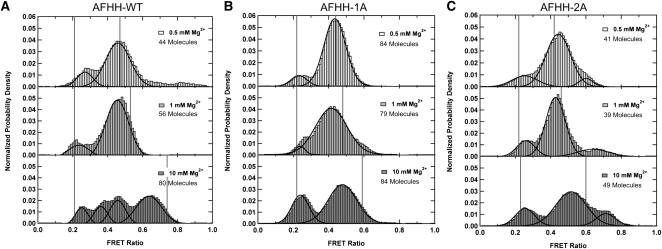
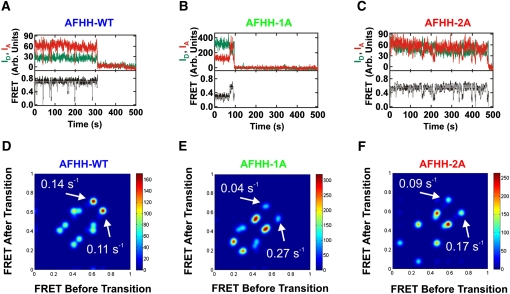
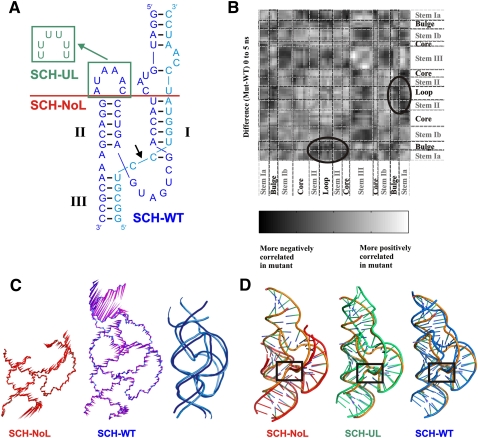
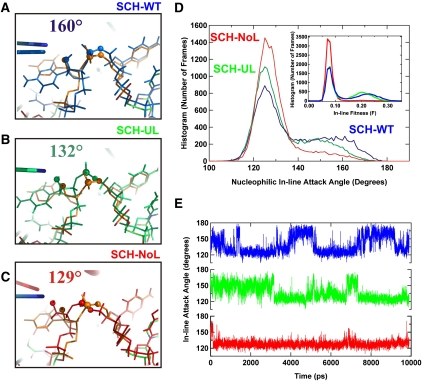
Enzymes generally are thought to derive their functional activity from conformational motions. The limited chemical variation in RNA suggests that such structural dynamics may play a particularly important role in RNA function. Minimal hammerhead ribozymes are known to cleave efficiently only in ∼ 10-fold higher than physiologic concentrations of Mg(2+) ions. Extended versions containing native loop-loop interactions, however, show greatly enhanced catalytic activity at physiologically relevant Mg(2+) concentrations, for reasons that are still ill-understood. Here, we use Mg(2+) titrations, activity assays, ensemble, and single molecule fluorescence resonance energy transfer (FRET) approaches, combined with molecular dynamics (MD) simulations, to ask what influence the spatially distant tertiary loop-loop interactions of an extended hammerhead ribozyme have on its structural dynamics. By comparing hammerhead variants with wild-type, partially disrupted, and fully disrupted loop-loop interaction sequences we find that the tertiary interactions lead to a dynamic motional sampling that increasingly populates catalytically active conformations. At the global level the wild-type tertiary interactions lead to more frequent, if transient, encounters of the loop-carrying stems, whereas at the local level they lead to an enrichment in favorable in-line attack angles at the cleavage site. These results invoke a linkage between RNA structural dynamics and function and suggest that loop-loop interactions in extended hammerhead ribozymes-and Mg(2+) ions that bind to minimal ribozymes-may generally allow more frequent access to a catalytically relevant conformation(s), rather than simply locking the ribozyme into a single active state.


Figures

FIGURE 1.
FIGURE 1.
Design and properties of AFHH hammerhead ribozyme and its variants. (A) Cleavage rate constants of AFHH variants with mutations to the loop regions. “Wild-type” AFHH-WT is shown in the top left. For each mutant ribozyme, the nucleotides that have been modified are highlighted in red. Observed cleavage rate constants are shown (blue) along with the relative reduction in rate (red) compared to AFHH-WT. All cleavage assays were conducted under standard conditions: 50 mM Tris-HCl (pH 8.0), 25°C, 1 mM MgCl2. (B) Representative cleavage assay time course of the chemically synthesized AFHH-WT ribozyme under standard conditions: 50 mM Tris-HCl (pH 8.0), 25°C, 1 mM MgCl2. Single (dashed line) and double (solid line) exponential fits are shown, with the double exponential giving a better fit (R2 of 0.99 vs. 0.97). The observed rate constant for the fast phase is 2.4 min−1 (fraction cleaved: 50%), that of the slow phase is 0.09 min−1 (15%). (C) Testing for structural homogeneity of the AFHH-WT ribozyme–substrate complex using a FRET-based electrophoretic mobility shift assay. The ribozyme strand (Rz) and noncleavable (NCS) or cleavable (S) substrate strands were annealed and run on a 10% nondenaturing polyacrylamide gel as described in Materials and Methods. The complex loaded into the “Rz+S (30 min)” lane was incubated for an additional 30 min at 37°C after the standard annealing protocol. Donor emission is shown in green, acceptor emission in red.
FIGURE 2.
FIGURE 2.
Modifications and cleavage activity of the hammerhead ribozymes used in this study. (A) Secondary structure of the AFHH-WT (AFHH; blue), as well as the partially disrupted (AFHH-1A; green) and fully disrupted (AFHH-2A; red) mutants, based on the sequence from Avocado Sunblotch Viroid (ASBV). Several putative interactions between the internal loops of Stems I and II are indicated as thin dashes. (B) Homology model showing possible orientation of the helices. Colors are the same as in A; the green base is the mutation in AFHH-1A, the red base is the additional mutation in AFHH-2A. (C) Characterization of cleavage rate dependence on Mg2+ concentration under standard conditions (50 mM Tris-HCl [pH 8.0], 25°C).
FIGURE 3.
FIGURE 3.
Distance distributions between stems I and II of the AFHH-WT (solid line), as well as partially disrupted (AFHH-1A; dashed line) and fully disrupted (AFHH-2A; dotted line) hammerhead mutants monitored by tr-FRET. (A) Mean distance and full width at half-maximum (FWHM) of the distance distributions (modeled as a single Gaussian) as a function of Mg2+ concentration under standard conditions (50 mM Tris-HCl [pH 8.0], 25°C). (B) tr-FRET measurements as in A, but the buffer included 100 mM Na+.
FIGURE 4.
FIGURE 4.
Single molecule FRET histograms, each constructed from 50–100 single molecule time traces prior to photobleaching of the acceptor under standard conditions (50 mM Tris-HCl [pH 8.0], 25°C, with varying Mg2+ concentration). Vertical solid gray lines are FRET ratios corresponding to the tr-FRET derived FWHMs. (A) AFHH-WT ribozyme; (top) 0.5 mM Mg2+, (middle) 1 mM Mg2+, (bottom) 10 mM Mg2+. (B) Partially disrupted mutant AFHH-1A; Mg2+ concentrations as in A. (C) Fully disrupted mutant AFHH-2A; Mg2+ concentrations as in A.
FIGURE 5.
FIGURE 5.
Single molecule FRET analysis. (AC) Exemplary single molecule time traces showing donor (green) and acceptor (red) intensities, and the corresponding FRET ratio (black) with HaMMy fit (gray). Conditions are, 50 mM Tris-HCl (pH 8.0), 10 mM Mg2+, at 25°C. (A) AFHH-WT ribozyme. (B) Partially disrupted AFHH-1A ribozyme. (C) Fully disrupted AFHH-2A ribozyme. (DF) Corresponding transition density plots for the same conditions as in AC, showing the FRET states, transitions between those states, and specific transition rate constants determined by fitting time traces with the software HaMMy (McKinney et al. 2006) for AFHH-WT AFHH (80 molecules; D), partially disrupted mutant AFHH-1A (84 molecules; E) and fully disrupted mutant AFHH-2A (49 molecules; F).
FIGURE 6.
FIGURE 6.
Molecular dynamics simulations of three S. mansoni hammerheads reveal differences in global structural dynamics. (A) Secondary structure of the three variants representing SCH-WT (crystal structure sequence [Martick and Scott 2006]), partially disrupted (SCH-UL; green), and fully disrupted mutants (SCH-NoL; red). (B) Global residue correlation difference map (SCH-UL minus SCH-WT) for the first 5 nsec of simulation time. Circled areas show where correlation between the loop and the bulge is lost for the U-loop mutant, SCH-UL. (C) Normal mode analysis. Porcupine plots (visualized using VMD) depict the motion of each backbone atom for the first normal mode of SCH-NoL (left) and SCH-WT (right) over the first 10 nsec of MD simulation. Arrows vectorially represent the magnitude and direction of movement. The right-most panel shows snapshots of the Pymol movie visualizing the first normal mode of SCH-WT; the two shades of blue represent the two extremes of the motion. (D) Alignment of simulated variants to the crystal structure (orange). The simulated structures are averages over the time period of 10.5–10.6 nsec. The core residues are aligned to the crystal structure core using Pymol. SCH-WT, blue; SCH-UL, green; SCH-NoL, red.
FIGURE 7.
FIGURE 7.
MD simulations also reveal differences in local structural dynamics. (AC) Close-up view of the alignment of simulated variants to the crystal structure. Boxed regions from Figure 6D are shown in more detail to highlight the cleavage site; (A) SCH-WT, blue; (B) SCH-UL, green; (C) SCH-NoL, red. (D) Nucleophilic in-line attack angle (IAA) for SCH-WT (blue), SCH-UL (green) and SCH-NoL (red) mutants. Histograms were constructed from angles measured every 100 psec over 10 nsec of simulation time. (Inset) The in-line fitness parameter was calculated as described (Soukup and Breaker 1999) and is plotted as a histogram. (E) IAAs for SCH-WT (blue), SCH-UL (green), and SCH-NoL (red) over 10 nsec of simulation time.

Similar articles

Cited by

References

    1. Abelson J, Blanco M, Ditzler MA, Fuller F, Aravamudhan P, Wood M, Villa T, Ryan DE, Pleiss JA, Maeder C, et al. 2010. Conformational dynamics of single pre-mRNA molecules during in vitro splicing. Nat Struct Mol Biol 17: 504–512 - PMC - PubMed
    1. Al-Hashimi HM, Walter NG 2008. RNA dynamics: It is about time. Curr Opin Struct Biol 18: 321–329 - PMC - PubMed
    1. Al-Hashimi H, Pitt S, Majumdar A, Xu W, Patel D 2003. Mg2+-induced variations in the conformation and dynamics of HIV-1 TAR RNA probed using NMR residual dipolar couplings. J Mol Biol 329: 867–873 - PMC - PubMed
    1. Amaral PP, Dinger ME, Mercer TR, Mattick JS 2008. The eukaryotic genome as an RNA machine. Science 319: 1787–1789 - PubMed
    1. Blount KF, Uhlenbeck OC 2005. The structure-function dilemma of the hammerhead ribozyme. Annu Rev Biophys Biomol Struct 34: 415–440 - PubMed

LinkOut - more resources