. 2010 Dec;30(23):5484-501.
doi: 10.1128/MCB.00575-10. Epub 2010 Oct 4.

Characterization of Puma-dependent and Puma-independent neuronal cell death pathways following prolonged proteasomal inhibition

Affiliations

Characterization of Puma-dependent and Puma-independent neuronal cell death pathways following prolonged proteasomal inhibition

Liam P Tuffy et al. Mol Cell Biol. 2010 Dec.

Abstract

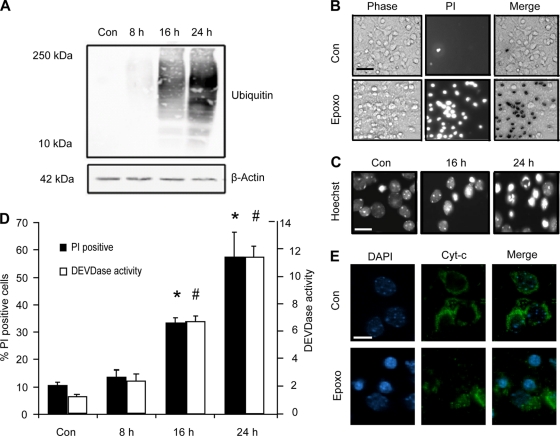
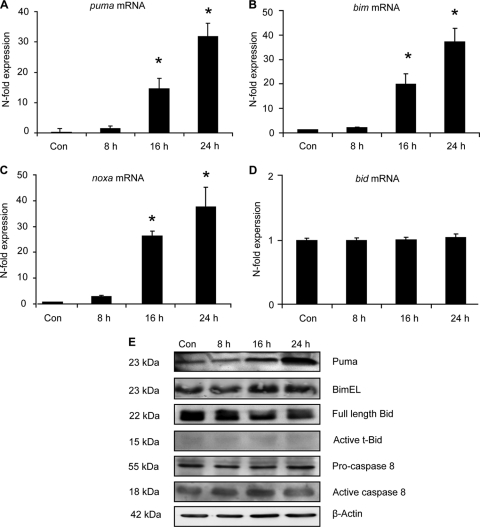
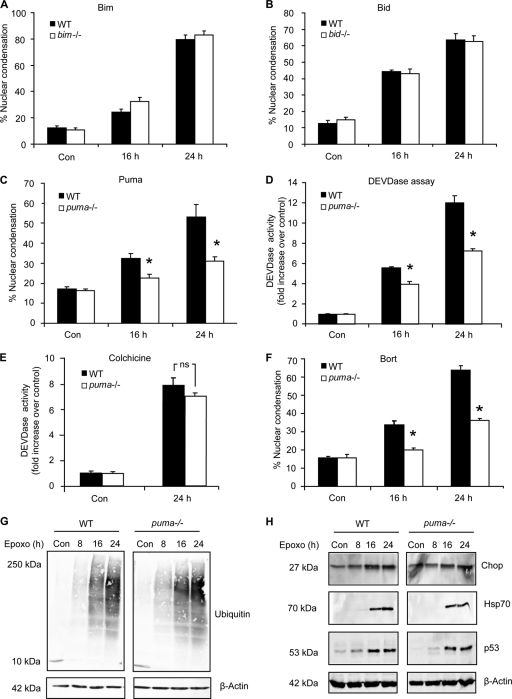
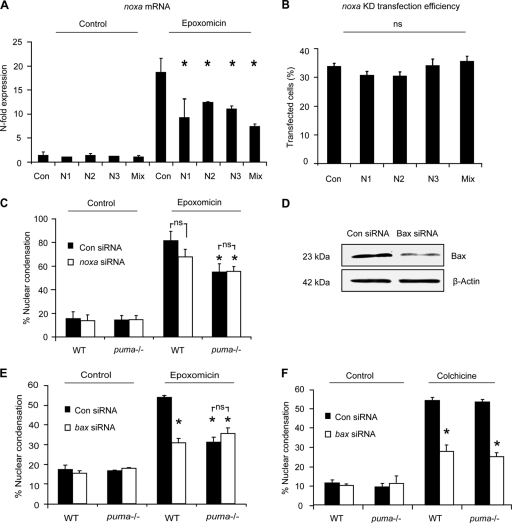
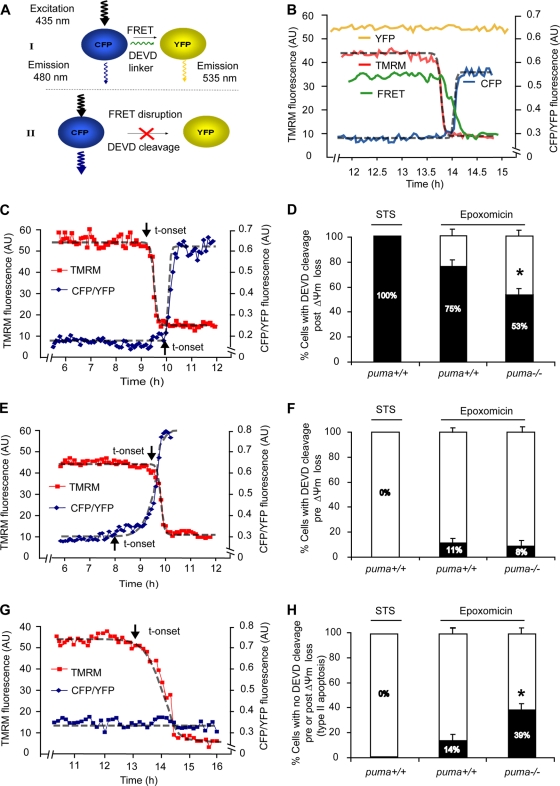
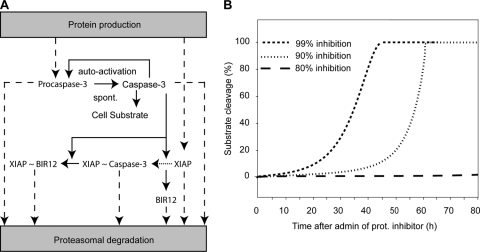
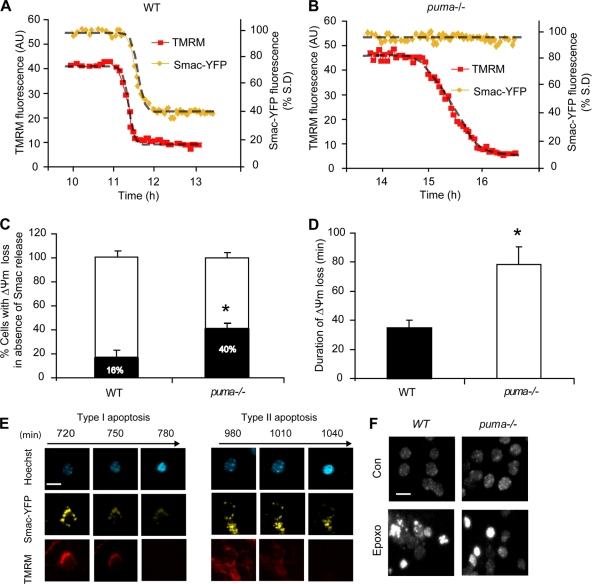
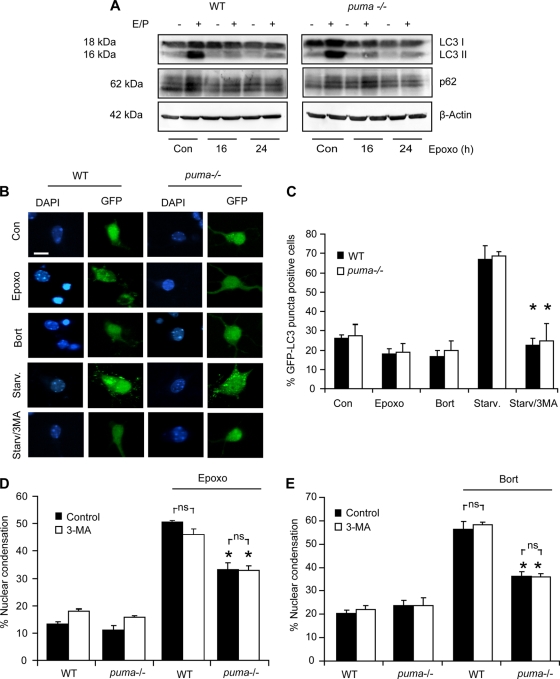
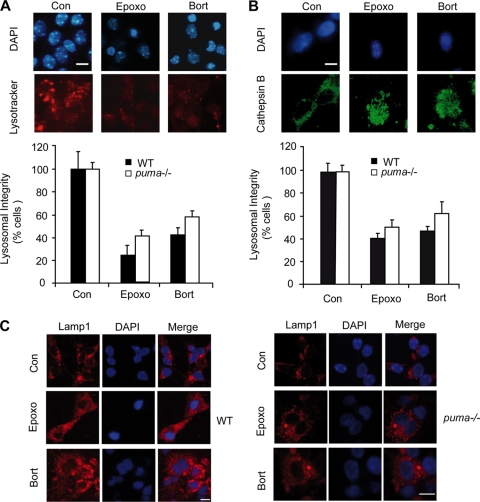
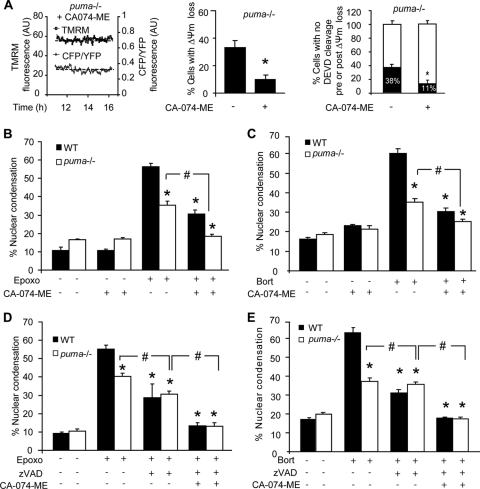
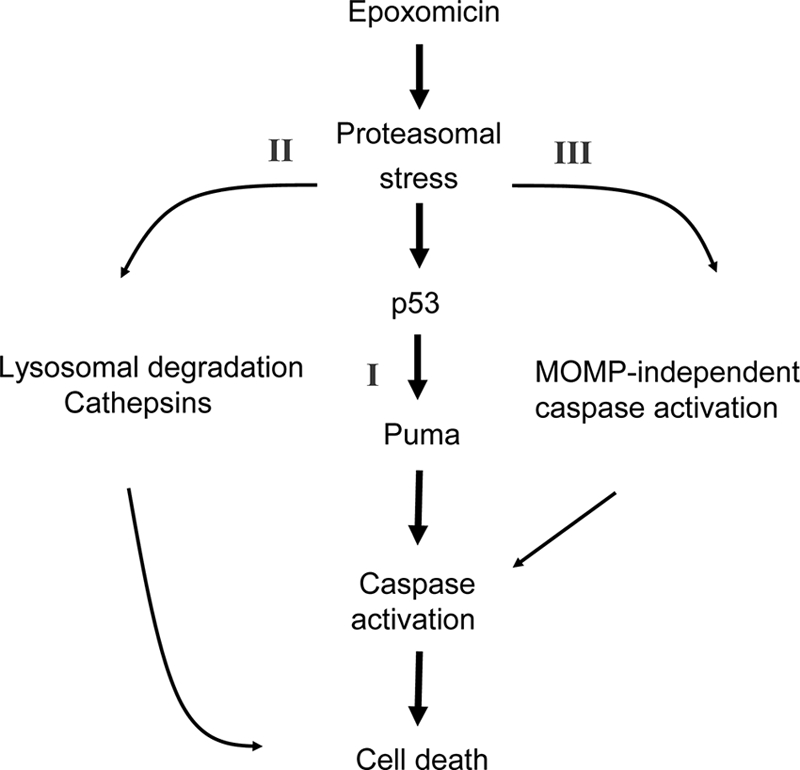
Proteasomal stress and the accumulation of polyubiquitinated proteins are key features of numerous neurodegenerative disorders. Previously we demonstrated that stabilization of p53 and activation of its target gene, puma (p53-upregulated mediator of apoptosis), mediated proteasome inhibitor-induced apoptosis in cancer cells. Here we demonstrated that Puma also contributed to proteasome inhibitor-induced apoptosis in mouse neocortical neurons. Although protection afforded by puma gene deletion was incomplete, we found little evidence indicating contributions from other proapoptotic BH3-only proteins. Attenuation of bax expression did not further reduce Puma-independent apoptosis, suggesting that pathways other than the mitochondrial apoptosis pathway were activated. Real-time imaging experiments in wild-type and puma-deficient neurons using a fluorescence resonance energy transfer (FRET)-based caspase sensor confirmed the involvement of a second cell death pathway characterized by caspase activation prior to mitochondrial permeabilization and, more prominently, a third, caspase-independent and Puma-independent pathway characterized by rapid cell shrinkage and nuclear condensation. This pathway involved lysosomal permeabilization in the absence of autophagy activation and was sensitive to cathepsin but not autophagy inhibition. Our data demonstrate that proteasomal stress activates distinct cell death pathways in neurons, leading to both caspase-dependent and caspase-independent apoptosis, and demonstrate independent roles for Puma and lysosomal permeabilization in this model.


Figures

FIG. 1.
FIG. 1.
Epoxomicin induces protein ubiquitination and cell death associated with cytochrome c release, caspase activation, and nuclear apoptotic morphology in neocortical neurons. (A) Cortical neurons were treated with epoxomicin (Epoxo; 50 nM) or the control (Con) (dimethyl sulfoxide [DMSO], 0.1%) for the indicated periods. Western blotting was performed using an antibody recognizing mono- and polyubiquitinated proteins. Probing for β-actin served as a loading control. (B) Bright-phase, PI-positive neurons and the merged image in control and neurons treated with epoxomicin for 24 h. Scale bar, 50 μm. (C) Hoechst-stained neurons illustrating nuclear condensation and fragmentation in DMSO- and epoxomicin-treated samples. Scale bar, 20 μm. (D) Quantification of PI-positive neurons and caspase-3-like (DEVDase) activity following epoxomicin treatment. PI-positive nuclei were expressed as a percentage of total cells per field. A minimum of 300 neurons in at least three different fields were captured per well, and at least three wells were analyzed per time point (*, P < 0.05 compared to control). Caspase 3-like activity was assessed by measuring the cleavage of the fluorogenic substrate Ac-DEVD-AMC (10 μM). DEVDase activity was expressed as fold increase over the control. The data are the results from three measurements per well and three wells per time point (#, P < 0.05 compared to control). (E) Immunocytochemistry of cytochrome c (Cyt-c) in neurons. The redistribution of cytochrome c is observed in treated samples (scale bar, 10 μm). All data are means ± SEM from three wells; experiments were repeated three times from independent cultures with similar results.
FIG. 2.
FIG. 2.
Determination of the transcriptional and posttranslational activation of BH3-only proteins. (A to D) Real-time quantitative PCR of BH3-only genes puma, bim, noxa, and bid. Cortical neurons were treated with epoxomicin (50 nM) or the control (DMSO; 0.1%) for the indicated time periods. The relative mRNA expression levels were assessed by RT-qPCR and normalized to β-actin mRNA levels. Expression levels were normalized to control-treated cells, and data are represented as means ± SEM from three wells. *, P < 0.05 compared to control-treated controls (ANOVA and Tukey's post hoc test). (E) Cortical neurons were treated with epoxomicin or DMSO for the indicated time periods. The expression of Puma, Bim, Bid, and caspase-8 was analyzed by Western blotting. Probing for β-actin served as the loading control. Similar results were observed in two other independent experiments. t-Bid, truncated Bid.
FIG. 3.
FIG. 3.
Cortical neurons deficient in puma are protected from proteasomal stress-induced apoptosis. (A to C) Cortical neurons from WT or bim/ (A), bid/ (B), or puma/ (C) mice were treated with epoxomicin (50 nM) or the control (DMSO; 0.1%), and cell death was assessed by quantifying apoptotic nuclei by Hoechst staining. Nuclear apoptosis was expressed as a percentage of total neurons in the field. Each field contained approximately 300 to 400 neurons, three fields were captured per well, and at least three wells were analyzed per time point. Data are means ± SEM from three wells per condition. *, P < 0.05 compared to similarly treated WT cultures (ANOVA and Tukey's post hoc test). (D and E) DEVDase activity of WT and puma/ cortical neurons was assessed following treatment with epoxomicin (D) or 10 μM colchicine (E). Data are expressed relative to control-treated cultures. (F) WT and puma/ neurons were treated with bortezomib (Bort; 100 nM), and cell death was assessed by quantifying the percentage of nuclear condensation. Data are means ± SEM from four cultures. *, P < 0.05 compared to WT-treated cultures (ANOVA and Tukey's post hoc test). (G and H) WT and puma/ cortical neurons were treated with epoxomicin (50 nM) for the indicated time periods. Protein levels of mono- and polyubiquitinylated proteins (G) or Chop, Hsp70, and p53 (H) were assessed by Western blotting. The experiments were repeated three times from different preparations with similar results.
FIG. 4.
FIG. 4.
Knockdown of proapoptotic Bcl-2 family genes noxa and bax, does not confer additional protection to puma/ neocortical neurons. Three noxa siRNAs were tested for their ability to attenuate noxa gene expression in neurons. (A) The siRNAs were transfected into neurons during culture preparation (DIV 0) using Amaxa (mouse neofection kit). Neurons were subsequently (DIV 5) treated with epoxomicin for 24 h or vehicle (DMSO, 0.1%), and samples were prepared for RT-qPCR. noxa gene expression was given as n-fold expression over control and normalized to β-actin. (B) The transfection efficiency of Amaxa-transfected neurons at DIV 5 was assessed by quantifying GFP-positive neurons within the cultures. KD, knockdown. (C) The number of apoptotic neurons from GFP-expressing cells in WT and puma/ in scramble or noxa siRNA-transfected neurons was quantified in control- or epoxomicin (50 nM)-treated samples after 24 h (n = 123 to 150 cells/time point quantified). *, P < 0.05 compared to epoxomicin-treated control siRNA (ANOVA and Tukey's post hoc test). ns, not significant. (D) Western blotting of Bax expression 24 h posttransfection with either control or Bax siRNA sequences. β-Actin served as a loading control. (E) The number of apoptotic nuclei in WT and puma/ neurons transfected with either Bax siRNA or scramble siRNA was quantified in control- or epoxomicin-treated cultures. siRNA was cotransfected with a plasmid expressing GFP to allow for identification of transfected neurons. (F) WT and puma/ cortical neurons were transfected with scramble or Bax siRNA and subsequently treated with colchicine (10 μM) or vehicle, and apoptosis was assessed as in panel E. *, P < 0.05 compared drug-treated control siRNA (ANOVA and Tukey's post hoc test). ns, not significant. The experiments were repeated three times with independent culture preparations with similar results.
FIG. 5.
FIG. 5.
FRET-based single-cell analysis of caspase-3-like activity and mitochondrial membrane potential in WT and puma/ neurons reveals caspase-dependent and caspase-independent cell death. (A and B) The SCAT3 FRET probe used consisted of CFP and YFP fluorophores linked together by a region containing the caspase-3 substrate sequence DEVD. Upon cleavage of the DEVD linker, the fluorescent resonance energy transfer (FRET) excitation between CFP and YFP is disrupted and detected by a decrease in FRET fluorescent intensity. This results in an increased energy transfer to CFP, as detected by an increase in CFP fluorescence. YFP excitation was used as a control for changes in fluorescence not directly related to probe cleavage, such as changes in cell volume, and therefore the data are expressed as a ratio of CFP to YFP. TMRM is used as a Δψm indicator in the nonquenched mode and measured in parallel. Here, WT neurons were treated with STS (300 nM, 8 h), or WT and puma/ neurons were treated with epoxomicin for 24 h on the stage of a Zeiss 5Live confocal microscope. Fluorescent measurements were captured for TMRM, FRET, CFP, and YFP in real-time. All neurons that lost Δψm were categorized into those where DEVD cleavage occurred prior to Δψm loss or post-Δψm loss or those in which no DEVD cleavage was detected. Sigmoidal fits were applied to traces and the point initiation of onset (indicated by arrows) or endpoints determined as previously described (48). (C, E, and G) Representative traces of cells which undergo FRET disruption post-Δψm loss (C) or prior to Δψm loss (E) or which undergo Δψm loss in the absence of FRET disruption (G). t-onset, time of onset. (D, F, and H) Quantification of the number of cells in STS-treated WT neurons (n = 11) or in epoxomicin (50 nM, 24 h)-treated WT (n = 75) and puma/ (n = 96) neurons with FRET disruption either prior to Δψm loss (D) or post-Δψm loss (F) or cells which undergo Δψm loss in the absence of FRET disruption (H). Data were obtained from 6 (WT-STS), 20 (WT-epoxo), and 28 (puma/-epoxo) separate experiments from 5 to 25 independent cultures. All data are means ± SEM. *, P < 0.05 compared to WT (D to H) as assessed by Fisher's exact t test.
FIG. 6.
FIG. 6.
Proteasome inhibition and subsequent reduced degradation of active caspases can lead to autoactivation. Shown is a mathematical model of apoptotic cell death through spontaneous (spont.) activation and imbalance of protein turnover. (A) Model schematic assuming a 0.1% initial, spontaneous caspase-3 activity which gets amplified by caspase-3 autofeedback. Cleavage of the cellular substrate is prevented through heterodimerization and inhibition of caspase-3 by XIAP (indicated by “XIAP ∼ Caspase-3”). The model further considered caspase-3 cleavage (solid arrows) of XIAP to its fragments BIR12 and BIR3R (neglected). Dashed arrows indicate the constant turnover of endogenous proteins XIAP and procaspase-3, as well as the decay of proteins that are activated in the signaling cascade. (B) Cellular substrate cleavage as a consequence of the deregulation of protein turnover balance induced by proteasome (prot.) inhibition. With inhibition higher than 90%, a robust cleavage of cellular substrate was predicted with onset of 5% substrate cleavage at approximately 10 to 30 h. Inhibitions less than 80% led to a complete abolishment of robust caspase-3 activation and therefore no substrate cleavage. admin, administration.
FIG. 7.
FIG. 7.
Characterization of puma- and caspase-independent cell death. WT (A) and puma/ (B) neurons were transfected with Smac-YFP and 24 h posttransfection loaded with TMRM (20 nM) in experimental buffer and mounted on the thermostatically regulated stage of a Zeiss 5Live confocal microscope. Neurons were treated with epoxomicin (50 nM), and images were acquired every 5 min. (C) Quantification of the percentage of WT and puma/ neurons where Δψm loss occurred in the absence of Smac release. Smac release was taken as reduction in the standard deviation (S.D.) of Smac-YFP fluorescence (n = 26 and n = 15 cells for WT and puma/ neurons, respectively, from at least five independent experiments; *, P < 0.05 for comparisons as assessed by Fisher's exact t test). (D) Duration of Δψm loss was measured in WT neurons undergoing FRET disruption and puma-deficient neurons in which disruption was absent (n = 15 for WT and n = 16 for puma/ cells from at least 10 independent experiments; *, P < 0.05). (E) Images illustrating type I and type II apoptosis. puma/ neurons were transfected with Smac-YFP and 24 h posttransfection loaded with TMRM (20 nM) and Hoechst (1 μg/ml) in experimental buffer. Neurons were treated with epoxomicin (50 nM), and images were acquired in real time every 5 min. Scale bar, 10 μm. (F) Images illustrating the lack of nuclear fragmentation in puma/ neurons. WT and puma/ neurons were treated with epoxomicin (50 nM) and stained with Hoechst 24 h posttreatment. Scale bar, 15 μm.
FIG. 8.
FIG. 8.
Autophagy is not active at time points associated with epoxomicin-induced cell death. (A) WT and puma/ cortical neurons were treated with epoxomicin in the presence or absence of E64-D/pepstatin A (E/P; 10 μg/ml). Western blotting was performed for LC3 and p62. β-Actin was used as a loading control. (B) WT and puma/ neurons were transfected with GFP-LC3, and 24 h posttransfection, the neurons were treated with epoxomicin (50 nM) or bortezomib (100 nM) for 24 h or serum starved (Starv.) in Hanks' balanced salt solution (HBSS) for 4 h in the presence and absence of 1 mM autophagy inhibitor 3-methyl adenine (3-MA). Scale bar, 10 μm. (C) Quantification of the percentage of GFP-LC3 cells positive for puncta in neurons treated as described in panel B above (n = 200 to 300 cells/treatment). Similar results were observed in two independent experiments. (D and E) WT and puma/ cortical neurons were treated with epoxomicin (D) or bortezomib (E) in the presence or absence of 3-MA. Cells with condensed nuclei were expressed as a percentage of total neurons in a field. All data are means ± SEM. *, P < 0.05 compared to the WT control (Con) (ANOVA and Tukey's post hoc test). Experiments were repeated three times from independent cultures with similar results.
FIG. 9.
FIG. 9.
Proteasomal stress induces lysosomal leakage. (A) WT and puma/ neurons were treated with epoxomicin (50 nM), bortezomib (100 nM), or vehicle (0.1% DMSO) for 24 h in the presence of Lysotracker Red (0.25 μM). Determination of the reduction in lysosomal membrane integrity was assessed by quantification of the percentage of cells with reduced Lysotracker puncta/staining. Images were captured from random fields (200 to 300 neurons/field) with three fields captured per well under identical camera settings, and three wells were analyzed per time point. (B) Neurons were treated with epoxomicin (50 nM) or bortezomib (100 nM) for 24 h and stained for cathepsin B. Lysosomal disruption was assessed by quantification of the percentage of cells with redistributed cathepsin B staining. Images were captured from random fields, with each field assessed containing approximately 100 neurons, three fields were captured per well, and three wells were analyzed per time point. (C) WT and puma/ cortical neurons were treated with epoxomicin (50 nM) or bortezomib (100 nM) for 24 h and stained for LAMP1, a membrane-associated lysosomal marker (scale bar, 10 μm). Experiments were performed three times from independent cultures with similar results obtained.
FIG. 10.
FIG. 10.
Proteasomal stress induces cathepsin-mediated caspase-independent cell death. (A) puma/ neurons were protected from cell death in the presence of CA-074-ME, as indicated by reduced loss of Δψm and FRET disruption. Shown is quantification of the number of cells undergoing FRET disruption in Puma-deficient neurons in the presence or absence of CA074-ME (n = 15 and n = 18 cells, respectively). AU, arbitrary units. *, P < 0.05 as assessed by Fisher's exact t test. (B and C) WT and puma/ cortical neurons were treated with epoxomicin (B) or bortezomib (C) in the presence or absence of CA-074-ME (10 μM). The number of neurons with apoptotic nuclei was expressed as a percentage of total neurons in a field. *, P < 0.05 compared to WT treated; #, P < 0.05, as indicated (ANOVA and Tukey's post hoc test). (D and E) WT and puma/ cortical neurons were treated with epoxomicin (D) or bortezomib (E) in the presence or absence of CA074-ME (10 μM) and/or Z-VAD-FMK (100 μM). The number of neurons with condensed nuclei was expressed as a percentage of total neurons in a field. Data are shown as means ± SEM. *, P < 0.05 compared to WT treated cultures; #, P < 0.05, as indicated (ANOVA and Tukey's post hoc test). Experiments were carried out at least three times from independent cultures with similar results.
FIG. 11.
FIG. 11.
Proposed pathways of proteasomal stress-induced cell death. In neocortical neurons, proteasome inhibition induces three distinct cell death pathways. Increased levels of p53 and the p53 target gene puma partially mediate caspase-dependent cell death. In addition, in a small number of neurons, mitochondrion-independent activation of caspases may occur. Moreover, lysosomal degradation and cathepsin-mediated cell death constitute another distinct cell death pathway, which may substitute for puma deficiency following proteotoxic stress.

Similar articles

Cited by

References

    1. Anan, A., E. S. Baskin-Bey, S. F. Bronk, N. W. Werneburg, V. H. Shah, and G. J. Gores. 2006. Proteasome inhibition induces hepatic stellate cell apoptosis. Hepatology 43:335-344. - PubMed
    1. Berndtsson, M., M. Beaujouin, L. Rickardson, A. M. Havelka, R. Larsson, J. Westman, E. Liaudet-Coopman, and S. Linder. 2009. Induction of the lysosomal apoptosis pathway by inhibitors of the ubiquitin-proteasome system. Int. J. Cancer 124:1463-1469. - PubMed
    1. Biswas, S. C., E. Ryu, C. Park, C. Malagelada, and L. A. Greene. 2005. Puma and p53 play required roles in death evoked in a cellular model of Parkinson disease. Neurochem. Res. 30:839-845. - PubMed
    1. Boland, B., A. Kumar, S. Lee, F. M. Platt, J. Wegiel, W. H. Yu, and R. A. Nixon. 2008. Autophagy induction and autophagosome clearance in neurons: relationship to autophagic pathology in Alzheimer's disease. J. Neurosci. 28:6926-6937. - PMC - PubMed
    1. Bonfoco, E., S. Ceccatelli, L. Manzo, and P. Nicotera. 1995. Colchicine induces apoptosis in cerebellar granule cells. Exp. Cell Res. 218:189-200. - PubMed

Publication types

MeSH terms