

Endogenous oncogenic Nras mutation promotes aberrant GM-CSF signaling in granulocytic/monocytic precursors in a murine model of chronic myelomonocytic leukemia
- PMID: 20921338
- PMCID: PMC3031386
- DOI: 10.1182/blood-2010-04-281527
Endogenous oncogenic Nras mutation promotes aberrant GM-CSF signaling in granulocytic/monocytic precursors in a murine model of chronic myelomonocytic leukemia
Abstract
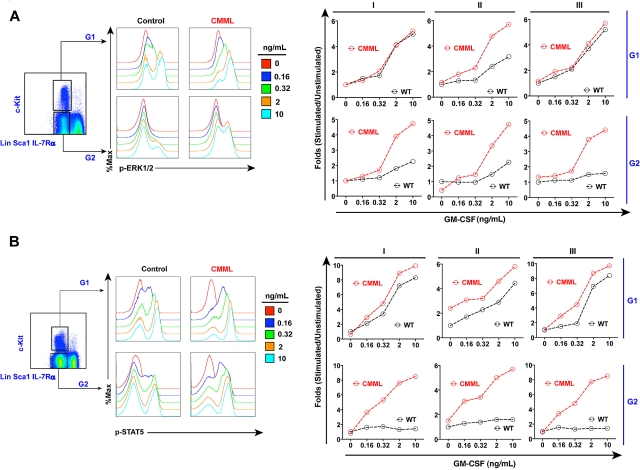
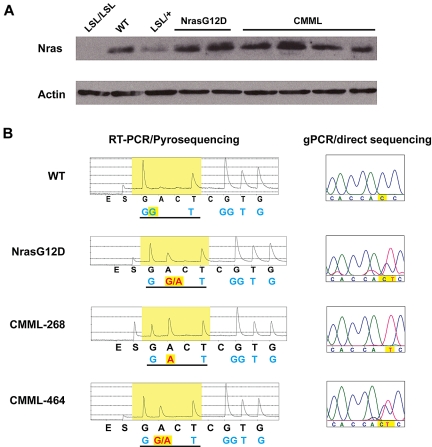
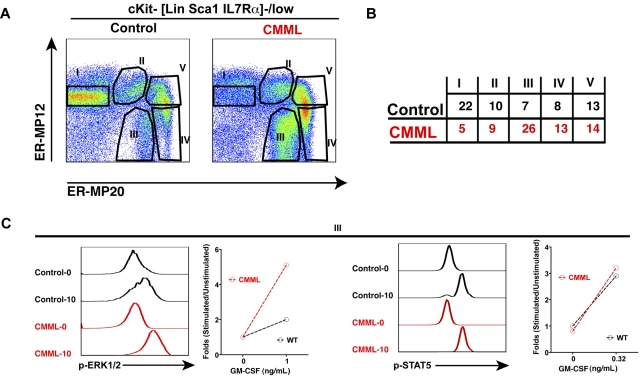
Oncogenic NRAS mutations are frequently identified in myeloid diseases involving monocyte lineage. However, its role in the genesis of these diseases remains elusive. We report a mouse bone marrow transplantation model harboring an oncogenic G12D mutation in the Nras locus. Approximately 95% of recipient mice develop a myeloproliferative disease resembling the myeloproliferative variant of chronic myelomonocytic leukemia (CMML), with a prolonged latency and acquisition of multiple genetic alterations, including uniparental disomy of oncogenic Nras allele. Based on single-cell profiling of phospho-proteins, a novel population of CMML cells is identified to display aberrant granulocyte-macrophage colony stimulating factor (GM-CSF) signaling in both the extracellular signal-regulated kinase (ERK) 1/2 and signal transducer and activator of transcription 5 (Stat5) pathways. This abnormal signaling is acquired during CMML development. Further study suggests that aberrant Ras/ERK signaling leads to expansion of granulocytic/monocytic precursors, which are highly responsive to GM-CSF. Hyperactivation of Stat5 in CMML cells is mainly through expansion of these precursors rather than up-regulation of surface expression of GM-CSF receptors. Our results provide insights into the aberrant cytokine signaling in oncogenic NRAS-associated myeloid diseases.
Figures
Similar articles
-
Deficiency of β Common Receptor Moderately Attenuates the Progression of Myeloproliferative Neoplasm in NrasG12D/+ Mice.J Biol Chem. 2015 Jul 31;290(31):19093-103. doi: 10.1074/jbc.M115.653154. Epub 2015 Jun 16. J Biol Chem. 2015. PMID: 26082490 Free PMC article.
-
GM-CSF-dependent pSTAT5 sensitivity is a feature with therapeutic potential in chronic myelomonocytic leukemia.Blood. 2013 Jun 20;121(25):5068-77. doi: 10.1182/blood-2012-10-460170. Epub 2013 Apr 30. Blood. 2013. PMID: 23632888 Free PMC article.
-
Human somatic PTPN11 mutations induce hematopoietic-cell hypersensitivity to granulocyte-macrophage colony-stimulating factor.Blood. 2005 May 1;105(9):3737-42. doi: 10.1182/blood-2004-10-4002. Epub 2005 Jan 11. Blood. 2005. PMID: 15644411 Free PMC article.
-
Chronic myelomonocytic leukemia: myeloproliferative variant.Curr Hematol Rep. 2004 May;3(3):218-26. Curr Hematol Rep. 2004. PMID: 15087071 Review.
-
Role of the bone marrow immune microenvironment in chronic myelomonocytic leukemia pathogenesis: novel mechanisms and insights into clonal propagation.Leuk Lymphoma. 2022 Aug;63(8):1792-1800. doi: 10.1080/10428194.2022.2056175. Epub 2022 Apr 4. Leuk Lymphoma. 2022. PMID: 35377828 Review.
Cited by
-
Phospholipase Cγ1 is required for pre-TCR signal transduction and pre-T cell development.Eur J Immunol. 2017 Jan;47(1):74-83. doi: 10.1002/eji.201646522. Epub 2016 Nov 7. Eur J Immunol. 2017. PMID: 27759161 Free PMC article.
-
Synergy of NUP98-HOXA10 Fusion Gene and NrasG12D Mutation Preserves the Stemness of Hematopoietic Stem Cells on Culture Condition.Cells. 2019 Aug 22;8(9):951. doi: 10.3390/cells8090951. Cells. 2019. PMID: 31443434 Free PMC article.
-
Myelodysplasia in autosomal dominant and sporadic monocytopenia immunodeficiency syndrome: diagnostic features and clinical implications.Haematologica. 2011 Aug;96(8):1221-5. doi: 10.3324/haematol.2011.041152. Epub 2011 Apr 20. Haematologica. 2011. PMID: 21508125 Free PMC article. Clinical Trial.
-
Endogenous oncogenic Nras mutation initiates hematopoietic malignancies in a dose- and cell type-dependent manner.Blood. 2011 Jul 14;118(2):368-79. doi: 10.1182/blood-2010-12-326058. Epub 2011 May 17. Blood. 2011. PMID: 21586752 Free PMC article.
-
Oncogenic NRAS hyper-activates multiple pathways in human cord blood stem/progenitor cells and promotes myelomonocytic proliferation in vivo.Am J Transl Res. 2015 Oct 15;7(10):1963-73. eCollection 2015. Am J Transl Res. 2015. PMID: 26692939 Free PMC article.
References
-
- Bos JL. ras oncogenes in human cancer: a review. Cancer Res. 1989;49(17):4682–4689. - PubMed
-
- Bowen DT, Frew ME, Hills R, et al. RAS mutation in acute myeloid leukemia is associated with distinct cytogenetic subgroups but does not influence outcome in patients younger than 60 years. Blood. 2005;106(6):2113–2119. - PubMed
-
- Auewarakul CU, Lauhakirti D, Tocharoentanaphol C. Frequency of RAS gene mutation and its cooperative genetic events in Southeast Asian adult acute myeloid leukemia. Eur J Haematol. 2006;77(1):51–56. - PubMed
-
- Vardiman JW. Myelodysplastic/myeloproliferative diseases. Cancer Treat Res. 2004;121:13–43. - PubMed
-
- Elliott MA. Chronic neutrophilic leukemia and chronic myelomonocytic leukemia: WHO defined. Best Pract Res Clin Haematol. 2006;19(3):571–593. - PubMed
Publication types
MeSH terms
Substances
Grants and funding
LinkOut - more resources
Full Text Sources
Molecular Biology Databases
Miscellaneous
