. 2010 Oct 26;107(43):18640-5.
doi: 10.1073/pnas.1009346107. Epub 2010 Oct 4.

Development of the malaria parasite in the skin of the mammalian host

Affiliations

Development of the malaria parasite in the skin of the mammalian host

Pascale Gueirard et al. Proc Natl Acad Sci U S A. .

Abstract

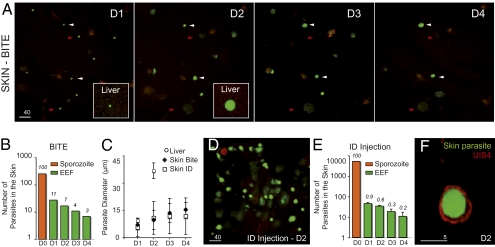
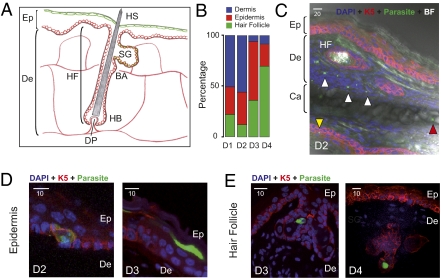
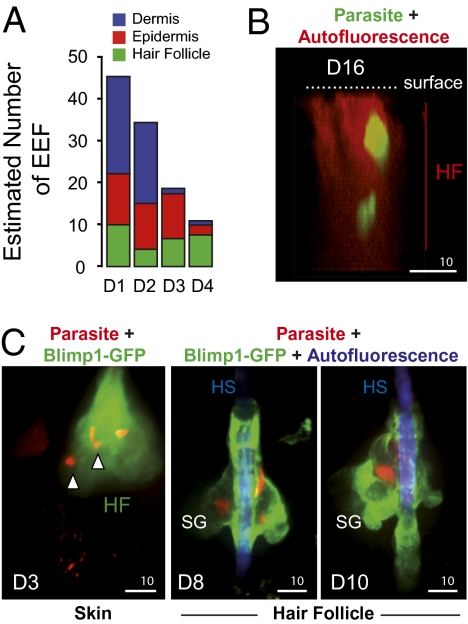
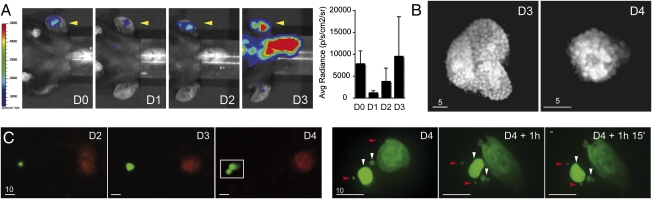
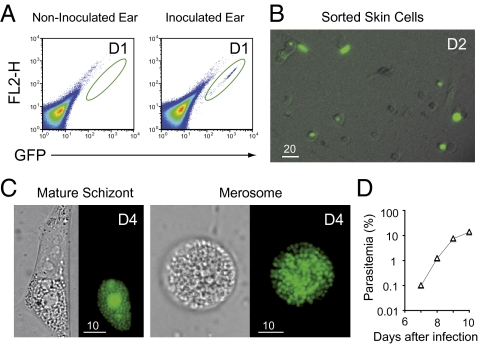
The first step of Plasmodium development in vertebrates is the transformation of the sporozoite, the parasite stage injected by the mosquito in the skin, into merozoites, the stage that invades erythrocytes and initiates the disease. The current view is that, in mammals, this stage conversion occurs only inside hepatocytes. Here, we document the transformation of sporozoites of rodent-infecting Plasmodium into merozoites in the skin of mice. After mosquito bite, ∼50% of the parasites remain in the skin, and at 24 h ∼10% are developing in the epidermis and the dermis, as well as in the immunoprivileged hair follicles where they can survive for weeks. The parasite developmental pathway in skin cells, although frequently abortive, leads to the generation of merozoites that are infective to erythrocytes and are released via merosomes, as typically observed in the liver. Therefore, during malaria in rodents, the skin is not just the route to the liver but is also the final destination for many inoculated parasites, where they can differentiate into merozoites and possibly persist.


Conflict of interest statement

The authors declare no conflict of interest.

Figures

Fig. 1.
Fig. 1.
P. berghei differentiation in the ear skin of a hairless mouse. (A) Parasites (in green) imaged for 4 d (autofluorescence in red) after sporozoite inoculation by the bite of a single mosquito. Images are maximal Z-projections of 13–21 contiguous pictures separated by 5 μm. Red arrowheads, fluorescent parasites fading over time; white arrowheads, brightly fluorescent parasites until day 4 (D4). The lower-right inset shows a liver stage at the same scale at D1 and D2. (Scale bar, 40 μm.) (B) Cumulative numbers of developing parasites in six different bite sites from two independent experiments. Orange bar (D0), number of sporozoites detected after the bite (n = 258); green bars, number of brightly fluorescent EEF; numbers above the bars, percentages of developing parasites versus sporozoites imaged at D0. (C) Parasite diameter (average ± SD), estimated by the EEF maximum projection area, in the liver (circles) and in the skin (diamond, after bite; square, after injection). (D) Parasites (in green) at D2 after microinjection of 5,200 sporozoites. The image is a maximal Z-projection of 35 pictures covering 70 μm in depth. (Scale bar, 40 μm.) (E) Numbers of developing parasites after intradermal injection. Orange bar (D0), no. of injected sporozoites (5,200); green bars, numbers of brightly fluorescent EEF (average ± SD), in four injection sites; numbers above the bars, percentages of developing parasites vs. sporozoites injected at D0. Similar results were obtained after injection of larger number of sporozoites (75,000–300,000 parasites). (F) Green fluorescent EEF surrounded by a parasitophorous vacuole stained with anti-UIS4 polyclonal antibody (in red) at D2. (Scale bar, 5 μm.)
Fig. 2.
Fig. 2.
Localization of P. berghei skin EEF. (A) Schematic view of the epidermis, dermis, and hair follicle of the mammalian skin. Drawn are the keratin5-positive keratinocytes (in red) that rest on the basement membrane separating the dermis from the epidermis and line the invagination of the HF; the Blimp1-positive cells (in green) associated with the superficial layer of the epidermis and the HF; and the vascularization in the dermis (red lines). Ep, epidermis; De, dermis; HF, hair follicle; HS, hair shaft; SG, sebaceous gland; BA, bulge area; HB, hair bulb; DP, dermal papilla. (B) Percentage of dermal (blue), epidermal (red), and hair follicle-associated (green) parasites in the mouse ear estimated by immunofluorescence microscopy at various days after intradermal injection of sporozoites. Number of analyzed EEF for each time point: 33–63. (C) Confocal image showing EEF (in green) in the deep dermis (white arrowheads), the epidermis (yellow arrowhead), and the cartilage (red arrowhead). Abbreviations are as in A; Ca, cartilage. (Scale bar, 20 μm.) (D) Confocal images of epidermal EEF (in green), associated with keratin5-positive keratinocytes of the basal layer of the epidermis (Left) or with keratin5-negative keratinocytes of the superficial layers of the epidermis (Right). Abbreviations are as in A. (Scale bar, 10 μm.) (E) Confocal images of hair follicle-associated EEF. EEF (in green) are located in the upper portion of the HF, in keratin5-positive or keratin5-negative cells, often near the sebaceous glands. Abbreviations are as in A. (Scale bar, 10 μm.)
Fig. 3.
Fig. 3.
P. berghei association with hair follicles. (A) Numbers of dermal, epidermal, and hair follicle-associated EEF after intradermal injection of sporozoites, obtained by multiplying the numbers of skin EEF counted by intravital microscopy (Fig. 1E) by the percentages of dermal, epidermal, and hair follicle-associated parasites counted by histology (Fig. 2B). (B) Intravital confocal image showing EEF surviving inside a hair follicle in the ear of a hairless mouse at D16 after microinjection of sporozoites. The images are a lateral view of a 3D reconstruction of the skin. Parasites are in green and the hair follicle autofluoresces in red. (Scale bar, 10 μm.) (C) Intravital confocal images showing red fluorescent EEF in the ear skin of a Blimp1-GFP mouse. (Left) D3: Z-projection of 70 slices covering 35 μm showing red fluorescent EEF inside a hair follicle (white arrowheads). (Center) D8 and (Right) D10: red EEF in a hair follicle in close association with Blimp1-GFP-positive cells. (Scale bars, 10 μm.)
Fig. 4.
Fig. 4.
P. berghei complete development inside skin cells. (A) Parasite development in the skin measured by bioluminescence. The 2 × 10⁴ GFP::LUC sporozoites were microinjected in the ear of C57BL6 mice (yellow arrowhead) and recorded from D0 to D3 following injection of luciferin. The graph represents the difference between the average radiance of the inoculated ear and the contralateral ear at D0, 1, 2, and 3 (mean ± SD; n = 3). (B) Mature schizonts in the skin. Intravital imaging of merozoite-filled EEF in the ears of mice at D3 and D4. (Scale bars, 5 μm.) (C) Skin EEF release merosomes. (Left) Skin EEF growing and budding between D3 and D4 after mosquito bite. (Right) Time-lapse recording of the squared area depicted at D4 and shows the release and movement of fluorescent structures of various sizes. White arrowheads, merosomes; red arrowheads, merozoites. (Scale bars, 10 μm.)
Fig. 5.
Fig. 5.
Merozoite production by and in vivo infectivity of P. berghei skin EEF. (A) Sorting of infected skin cells. The 1.0–2.5 × 10⁵ sporozoites were microinjected in the ear of C57BL6 mice. The pseudocolor plot shows the distribution of skin cells obtained from the ears of noninfected (Left) and infected mice (Right) 1 d postinfection. The green oval represents the gate used for sorting the infected skin cells, which were collected in 96-wells cell culture plate and kept at 37 °C, 5% CO2 in DMEM 10% FCS. No events were detected using the noninfected ear. (B) Wide-field microscopy of sorted cells showing the variety of infected skin cell types (bright field and green) at D2—1 d in the skin and 1 d in vitro. (Scale bar, 20 μm.) (C) Generation of merozoites within skin cells. Presence of merozoites inside an adherent skin cell (Left) and in a floating merosome (Right). (Scale bar, 10 μm.) (D) A representative parasitemia curve following injection of merozoite-filled skin cells at D4—1 d in the skin and 3 d cultured in vitro. The number of events sorted at D1 in this experiment was 1,200 (∼600 GFP+ cells), resulting in approximately four mature schizonts after 3 d in culture. The parasitemia was accessed by FACS and blood smear.

Similar articles

Cited by

References

    1. Huff CG. Life cycle of malarial parasites. Annu Rev Microbiol. 1947;1:43–60.
    1. Shortt HE, Garnham PC. Pre-erythrocytic stage in mammalian malaria parasites. Nature. 1948;161:126. - PubMed
    1. Vanderberg JP. Plasmodium berghei exoerythrocytic forms develop only in the liver. Trans R Soc Trop Med Hyg. 1981;75:904–905. - PubMed
    1. Meis JF, Verhave JP. Exoerythrocytic development of malarial parasites. Adv Parasitol. 1988;27:1–61. - PubMed
    1. Shortt HE, Garnham PC. Demonstration of a persisting exo-erythrocytic cycle in Plasmodium cynomolgi and its bearing on the production of relapses. BMJ. 1948;1:1225–1228. - PMC - PubMed

Publication types

MeSH terms

Substances

LinkOut - more resources