

Anaphase-promoting complex/cyclosome-Cdh1 coordinates glycolysis and glutaminolysis with transition to S phase in human T lymphocytes
- PMID: 20921411
- PMCID: PMC2973876
- DOI: 10.1073/pnas.1012362107
Anaphase-promoting complex/cyclosome-Cdh1 coordinates glycolysis and glutaminolysis with transition to S phase in human T lymphocytes
Abstract
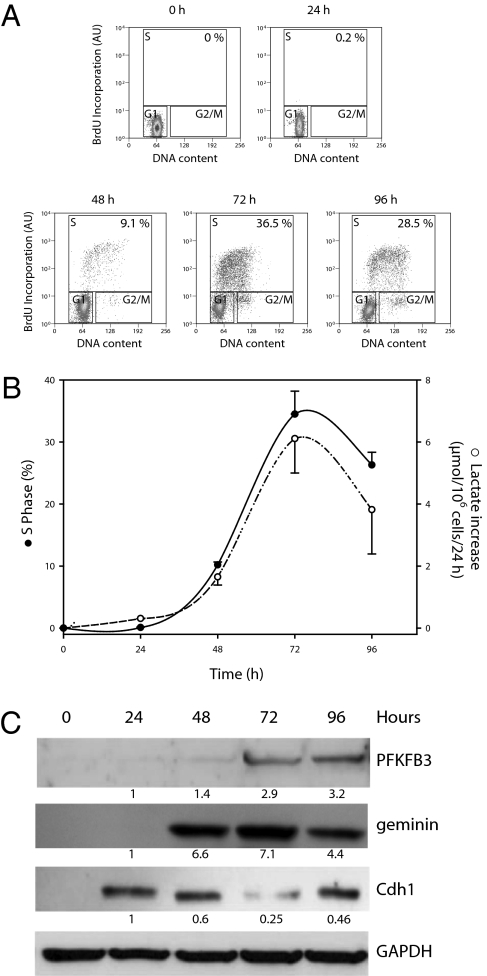
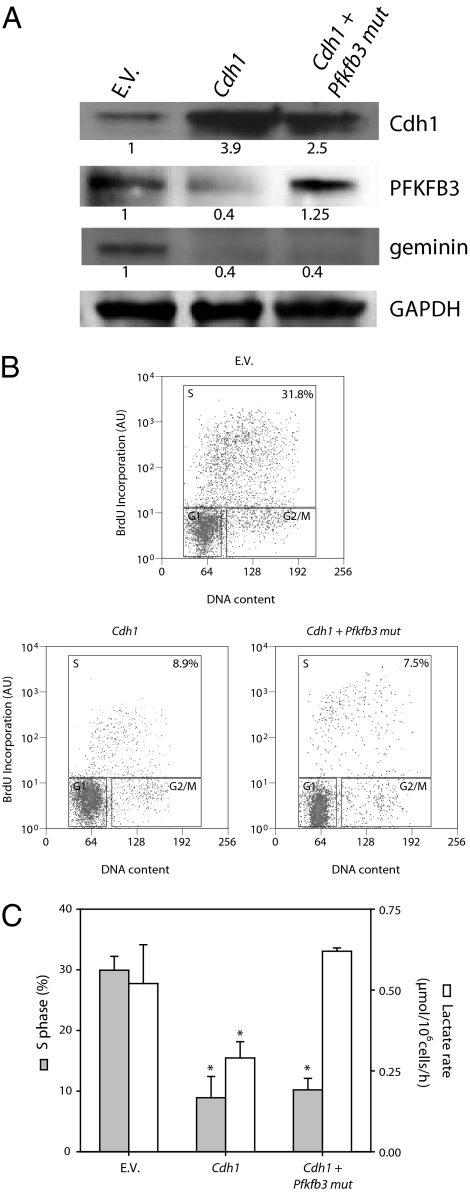
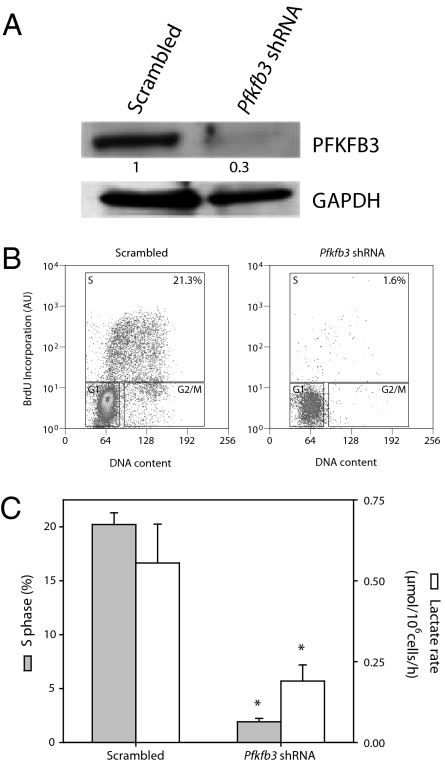
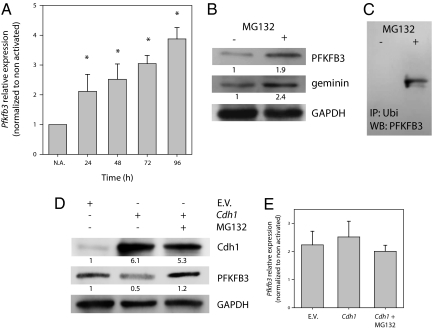
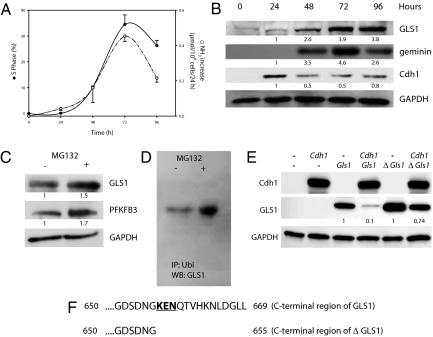
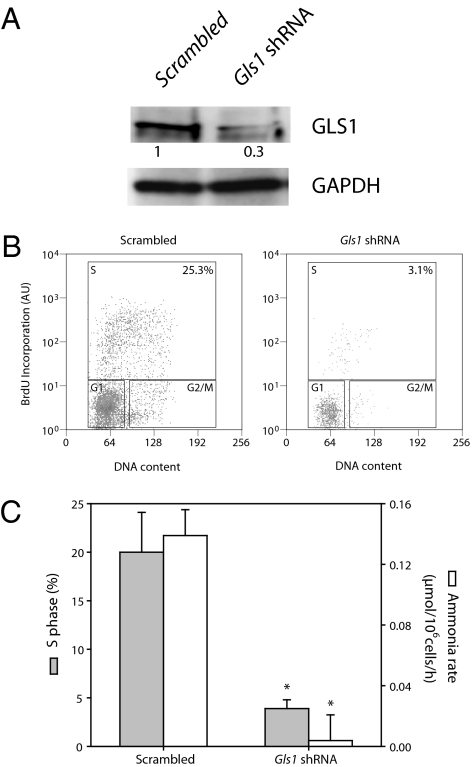
Cell proliferation is accompanied by an increase in the utilization of glucose and glutamine. The proliferative response is dependent on a decrease in the activity of the ubiquitin ligase anaphase-promoting complex/cyclosome (APC/C)-Cdh1 which controls G1-to-S-phase transition by targeting degradation motifs, notably the KEN box. This occurs not only in cell cycle proteins but also in the glycolysis-promoting enzyme 6-phosphofructo-2-kinase/fructose-2,6-bisphosphatase isoform 3 (PFKFB3), as we have recently demonstrated in cells in culture. We now show that APC/C-Cdh1 controls the proliferative response of human T lymphocytes. Moreover, we have found that glutaminase 1 is a substrate for this ubiquitin ligase and appears at the same time as PFKFB3 in proliferating T lymphocytes. Glutaminase 1 is the first enzyme in glutaminolysis, which converts glutamine to lactate, yielding intermediates for cell proliferation. Thus APC/C-Cdh1 is responsible for the provision not only of glucose but also of glutamine and, as such, accounts for the critical step that links the cell cycle with the metabolic substrates essential for its progression.
Conflict of interest statement
The authors declare no conflict of interest.
Figures
Comment in
-
Uncoupling the Warburg effect from cancer.Proc Natl Acad Sci U S A. 2010 Nov 9;107(45):19135-6. doi: 10.1073/pnas.1014047107. Epub 2010 Nov 1. Proc Natl Acad Sci U S A. 2010. PMID: 21041650 Free PMC article. No abstract available.
Similar articles
-
Molecular basis for the differential use of glucose and glutamine in cell proliferation as revealed by synchronized HeLa cells.Proc Natl Acad Sci U S A. 2011 Dec 27;108(52):21069-74. doi: 10.1073/pnas.1117500108. Epub 2011 Nov 21. Proc Natl Acad Sci U S A. 2011. PMID: 22106309 Free PMC article.
-
Two ubiquitin ligases, APC/C-Cdh1 and SKP1-CUL1-F (SCF)-beta-TrCP, sequentially regulate glycolysis during the cell cycle.Proc Natl Acad Sci U S A. 2011 Mar 29;108(13):5278-83. doi: 10.1073/pnas.1102247108. Epub 2011 Mar 14. Proc Natl Acad Sci U S A. 2011. PMID: 21402913 Free PMC article.
-
Glycolysis: a bioenergetic or a survival pathway?Trends Biochem Sci. 2010 Mar;35(3):145-9. doi: 10.1016/j.tibs.2009.10.006. Epub 2009 Dec 16. Trends Biochem Sci. 2010. PMID: 20006513 Review.
-
Multiple anaphase-promoting complex/cyclosome degrons mediate the degradation of human Sgo1.J Biol Chem. 2009 Jan 16;284(3):1772-80. doi: 10.1074/jbc.M807083200. Epub 2008 Nov 17. J Biol Chem. 2009. PMID: 19015261 Free PMC article.
-
Fulfilling the metabolic requirements for cell proliferation.Biochem J. 2012 Aug 15;446(1):1-7. doi: 10.1042/BJ20120427. Biochem J. 2012. PMID: 22835215 Review.
Cited by
-
Glucose to lactate shift reprograms CDK-dependent mitotic decisions and its communication with MAPK Sty1 in Schizosaccharomyces pombe.Biol Open. 2023 Oct 15;12(10):bio060145. doi: 10.1242/bio.060145. Epub 2023 Oct 24. Biol Open. 2023. PMID: 37787465 Free PMC article.
-
SIRT3 deficiency reduces PFKFB3-driven T-cell glycolysis and promotes arthritic inflammation.Sci China Life Sci. 2025 Jun;68(6):1755-1769. doi: 10.1007/s11427-024-2823-2. Epub 2025 Feb 27. Sci China Life Sci. 2025. PMID: 40029452
-
Regulation of mitochondrial morphology by APC/CCdh1-mediated control of Drp1 stability.Mol Biol Cell. 2011 Apr 15;22(8):1207-16. doi: 10.1091/mbc.E10-07-0567. Epub 2011 Feb 16. Mol Biol Cell. 2011. PMID: 21325626 Free PMC article.
-
Molecular basis for the differential use of glucose and glutamine in cell proliferation as revealed by synchronized HeLa cells.Proc Natl Acad Sci U S A. 2011 Dec 27;108(52):21069-74. doi: 10.1073/pnas.1117500108. Epub 2011 Nov 21. Proc Natl Acad Sci U S A. 2011. PMID: 22106309 Free PMC article.
-
From Krebs to clinic: glutamine metabolism to cancer therapy.Nat Rev Cancer. 2016 Oct;16(10):619-34. doi: 10.1038/nrc.2016.71. Epub 2016 Jul 29. Nat Rev Cancer. 2016. PMID: 27492215 Free PMC article. Review.
References
-
- Sasaki MS, Norman A. Proliferation of human lymphocytes in culture. Nature. 1966;210:913–914. - PubMed
-
- Michalowski A. Phytohaemagglutinin-stimulated division and growth rate of human lymphocytes. Bull Acad Pol Sci Biol. 1967;15:577–581. - PubMed
-
- Halliwell B. Oxidative stress in cell culture: An under-appreciated problem? FEBS Lett. 2003;540:3–6. - PubMed
-
- Hennessy BT, Smith DL, Ram PT, Lu Y, Mills GB. Exploiting the PI3K/AKT pathway for cancer drug discovery. Nat Rev Drug Discov. 2005;4:988–1004. - PubMed
Publication types
MeSH terms
Substances
Grants and funding
LinkOut - more resources
Full Text Sources
Other Literature Sources
Molecular Biology Databases
Miscellaneous
