

An atypical member of the light-harvesting complex stress-related protein family modulates diatom responses to light
- PMID: 20921421
- PMCID: PMC2964204
- DOI: 10.1073/pnas.1007703107
An atypical member of the light-harvesting complex stress-related protein family modulates diatom responses to light
Abstract
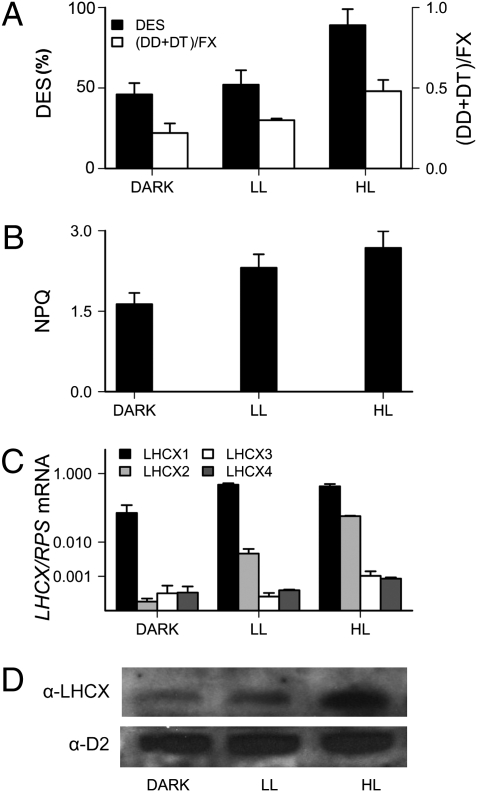
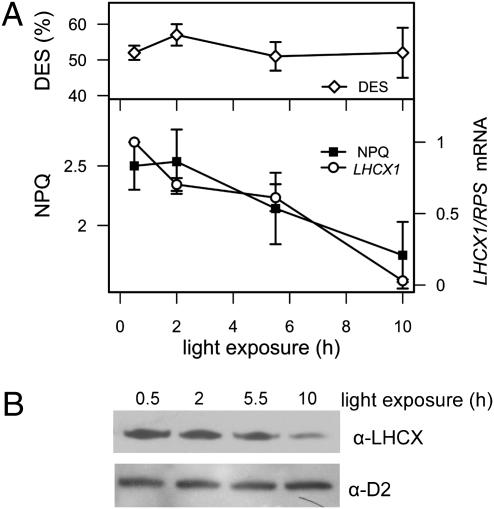
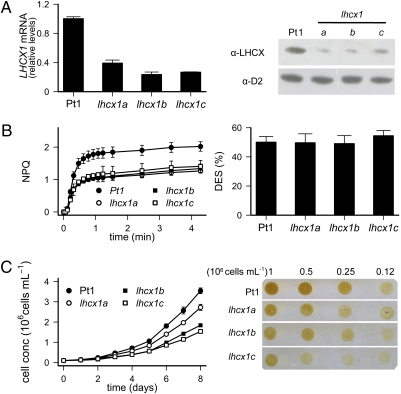
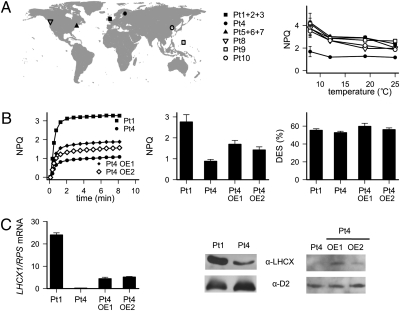
Diatoms are prominent phytoplanktonic organisms that contribute around 40% of carbon assimilation in the oceans. They grow and perform optimally in variable environments, being able to cope with unpredictable changes in the amount and quality of light. The molecular mechanisms regulating diatom light responses are, however, still obscure. Using knockdown Phaeodactylum tricornutum transgenic lines, we reveal the key function of a member of the light-harvesting complex stress-related (LHCSR) protein family, denoted LHCX1, in modulation of excess light energy dissipation. In contrast to green algae, this gene is already maximally expressed in nonstressful light conditions and encodes a protein required for efficient light responses and growth. LHCX1 also influences natural variability in photoresponse, as evidenced in ecotypes isolated from different latitudes that display different LHCX1 protein levels. We conclude, therefore, that this gene plays a pivotal role in managing light responses in diatoms.
Conflict of interest statement
The authors declare no conflict of interest.
Figures
Similar articles
-
Dynamic Changes between Two LHCX-Related Energy Quenching Sites Control Diatom Photoacclimation.Plant Physiol. 2018 Jul;177(3):953-965. doi: 10.1104/pp.18.00448. Epub 2018 May 17. Plant Physiol. 2018. PMID: 29773581 Free PMC article.
-
Multisignal control of expression of the LHCX protein family in the marine diatom Phaeodactylum tricornutum.J Exp Bot. 2016 Jun;67(13):3939-51. doi: 10.1093/jxb/erw198. Epub 2016 May 25. J Exp Bot. 2016. PMID: 27225826 Free PMC article.
-
Biochemical and molecular properties of LHCX1, the essential regulator of dynamic photoprotection in diatoms.Plant Physiol. 2022 Jan 20;188(1):509-525. doi: 10.1093/plphys/kiab425. Plant Physiol. 2022. PMID: 34595530 Free PMC article.
-
Structural features of the diatom photosystem II-light-harvesting antenna complex.FEBS J. 2020 Jun;287(11):2191-2200. doi: 10.1111/febs.15183. Epub 2020 Jan 7. FEBS J. 2020. PMID: 31854056 Review.
-
The evolution of the photoprotective antenna proteins in oxygenic photosynthetic eukaryotes.Biochem Soc Trans. 2018 Oct 19;46(5):1263-1277. doi: 10.1042/BST20170304. Epub 2018 Aug 28. Biochem Soc Trans. 2018. PMID: 30154089 Review.
Cited by
-
Electric Field Susceptibility of Chlorophyll c Leads to Unexpected Excitation Dynamics in the Major Light-Harvesting Complex of Diatoms.J Phys Chem Lett. 2024 Mar 7;15(9):2499-2510. doi: 10.1021/acs.jpclett.3c03241. Epub 2024 Feb 27. J Phys Chem Lett. 2024. PMID: 38410961 Free PMC article.
-
Photosystem II photoinactivation, repair, and protection in marine centric diatoms.Plant Physiol. 2012 Sep;160(1):464-76. doi: 10.1104/pp.112.203067. Epub 2012 Jul 24. Plant Physiol. 2012. PMID: 22829321 Free PMC article.
-
Genome and low-iron response of an oceanic diatom adapted to chronic iron limitation.Genome Biol. 2012 Jul 26;13(7):R66. doi: 10.1186/gb-2012-13-7-r66. Genome Biol. 2012. PMID: 22835381 Free PMC article.
-
Transcriptome analysis of the typical freshwater rhodophytes Sheathia arcuata grown under different light intensities.PLoS One. 2018 May 29;13(5):e0197729. doi: 10.1371/journal.pone.0197729. eCollection 2018. PLoS One. 2018. PMID: 29813098 Free PMC article.
-
Photoprotective, excited-state quenching mechanisms in diverse photosynthetic organisms.J Biol Chem. 2018 Apr 6;293(14):5018-5025. doi: 10.1074/jbc.TM117.000233. Epub 2018 Jan 3. J Biol Chem. 2018. PMID: 29298897 Free PMC article. Review.
References
-
- Smetacek V. Diatoms and the ocean carbon cycle. Protist. 1999;150:25–32. - PubMed
-
- Bowler C, Vardi A, Allen AE. Oceanographic and biogeochemical insights from diatom genomes. Annu Rev Mar Sci. 2010;2:333–365. - PubMed
-
- Kirk JYO. Light and Photosynthesis in the Aquatic Ecosystems. Cambridge, UK: Cambridge Univ Press; 1994.
-
- Harris G. Phytoplankton Ecology. Structure, Function and Fluctuation. London, UK: Chapman and Hall; 1986.
Publication types
MeSH terms
Substances
LinkOut - more resources
Full Text Sources
