. 2010 Dec 10;285(50):38933-43.
doi: 10.1074/jbc.M110.132860. Epub 2010 Oct 5.

Inhibitors of catalase-amyloid interactions protect cells from beta-amyloid-induced oxidative stress and toxicity

Affiliations

Inhibitors of catalase-amyloid interactions protect cells from beta-amyloid-induced oxidative stress and toxicity

Lila K Habib et al. J Biol Chem. .

Abstract

Compelling evidence shows a strong correlation between accumulation of neurotoxic β-amyloid (Aβ) peptides and oxidative stress in the brains of patients afflicted with Alzheimer disease (AD). One hypothesis for this correlation involves the direct and harmful interaction of aggregated Aβ peptides with enzymes responsible for maintaining normal, cellular levels of reactive oxygen species (ROS). Identification of specific, destructive interactions of Aβ peptides with cellular anti-oxidant enzymes would represent an important step toward understanding the pathogenicity of Aβ peptides in AD. This report demonstrates that exposure of human neuroblastoma cells to cytotoxic preparations of aggregated Aβ peptides results in significant intracellular co-localization of Aβ with catalase, an anti-oxidant enzyme responsible for catalyzing the degradation of the ROS intermediate hydrogen peroxide (H(2)O(2)). These catalase-Aβ interactions deactivate catalase, resulting in increased cellular levels of H(2)O(2). Furthermore, small molecule inhibitors of catalase-amyloid interactions protect the hydrogen peroxide-degrading activity of catalase in Aβ-rich environments, leading to reduction of the co-localization of catalase and Aβ in cells, inhibition of Aβ-induced increases in cellular levels of H(2)O(2), and reduction of the toxicity of Aβ peptides. These studies, thus, provide evidence for the important role of intracellular catalase-amyloid interactions in Aβ-induced oxidative stress and propose a novel molecular strategy to inhibit such harmful interactions in AD.


Figures

FIGURE 1.
FIGURE 1.
Effect of aggregated Aβ(1–42) on the viability of SH-SY5Y cells and the cytoprotective effects of BTA-EGx against Aβ toxicity. A, structures of BTA-EG4 and BTA-EG6. B, viability of cells in the presence of 25 μm aggregated Aβ or 40 μm BTA-EGx compared with untreated cells (**, p < 0.01 compared with untreated control cells). Cells were exposed to Aβ or BTA-EGx for 24 h. C, protection of cell viability in the presence of 25 μm aggregated Aβ that was pre incubated with various concentrations of BTA-EGx. Data are expressed as mean values ± S.D., n = 3 for each concentration. *, p < 0.05 or **, p < 0.01 compared with cells incubated with 25 μm Aβ alone (i.e. in the absence of small molecules).
FIGURE 2.
FIGURE 2.
Detection of Aβ-induced increase in release of H2O2 from SH-SY5Y cells. A, H2O2 release from SH-SY5Y cells alone, or treated with BTA-EGx, aggregated Aβ, catalase inhibitor 3AT, or a combination of 3AT and BTA-EGx (**, p < 0.01 compared with untreated control cells). B, H2O2 release from SH-SY5Y cells treated with aggregated Aβ peptides that were preincubated with 1–40 μm concentrations of BTA-EGx. Results are reported relative to the H2O2 concentration released by untreated cells. *, p < 0.05 or **, p < 0.01 compared with cells treated with 25 μm Aβ alone. Data are expressed as mean values ± S.D., n = 3 for each concentration.
FIGURE 3.
FIGURE 3.
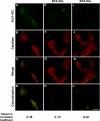
Co-localization of aggregated Aβ(1–42) with catalase in SH-SY5Y cells. A–D, fluorescence micrographs of representative z-slices within a cell show the co-localization of fluorescently-labeled aggregated Aβ peptides (A, green) with catalase (B, red). C represents a merged image of A and B. D, represents the areas of co-localization of A and B (yellow). E–H and I–L fluorescence micrographs of representative z-slices within a cell illustrating the reduced co-localization of Αβ peptides and catalase in the presence of the BTA-EGx molecules. Scale bar, 10 μm.
FIGURE 4.
FIGURE 4.
Co-immunoprecipitation of Aβ(1–42) with catalase in the presence or absence of the BTA-EGx molecules. SH-SY5Y cells that were treated with: (i) 25 μm Aβ (1–42) (lane 1), (ii) neither Aβ (1–42) nor the BTA-EGx molecules (lane 2), (iii) 25 μm Aβ preincubated with 40 μm BTA-EG4 (lane 3), and (iv) 25 μm Aβ preincubated with 40 μm BTA-EG6 (lane 4). All cells were immunoprecipitated with an anti-catalase antibody and subjected to Western blot analysis with anti-Aβ and anti-catalase antibodies. Catalase from human erythrocytes (lane 5) and pure Aβ(1–42) (lane 6) were also separated and stained on the same immunoblot (IB).
FIGURE 5.
FIGURE 5.
Internalization of aggregated Aβ(1–42) and BTA-EGx molecules by SH-SY5Y cells. A–C, fluorescence micrographs of representative z-slices within a cell showing that BTA-EG4 (A, blue) and fluorescently labeled aggregated Aβ peptides (B, green) internalize in SH-SY5Y cells. C represents areas of co-localization of Aβ with BTA-EG4 (yellow). D–F, fluorescence micrographs of representative z-slices within a cell showing that BTA-EG6 (D, blue) and fluorescently-labeled aggregated Aβ peptides (E, green) internalize in SH-SY5Y cells. F represents areas of co-localization of Aβ with BTA-EG6 (yellow). Scale bar, 10 μm. G, effect of BTA-EGx molecules on the cellular uptake of aggregated, fluorescently labeled Aβ(1–42) in SH-SY5Y cells. The histograms show the number of SH-SY5Y cells as a function of their total fluorescence intensity that were incubated with: (i) 5 μm fluorescently labeled Aβ (red curve) (ii) 5 μm fluorescently labeled Aβ preincubated with 40 μm BTA-EG4 (green curve), or (iii) 5 μm fluorescently labeled Aβ preincubated with 40 μm BTA-EG6 (blue curve) for 24 h. Data were generated by flow cytometry analysis of individual cells (>20,000 cells per sample). Statistical analysis of the data revealed that there was no significant difference in the cellular uptake of Aβ(1–42) incubated with or without the BTA-EGx molecules.
FIGURE 6.
FIGURE 6.
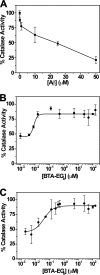
Inhibition of catalase activity by Aβ and preservation of catalase activity by BTA-EGx molecules in Αβ-rich solutions. A, catalase activity in the presence of increasing concentrations of aggregated Aβ. The results are expressed relative to activity of catalase in the absence of Aβ. B and C, catalase activity in the presence of presence of 25 μm aggregated Aβ and increasing concentrations of BTA-EG4 (B) or BTA-EG6 (C). Catalase activity was defined as 100% when no Aβ was present and as 0% when no catalase was present in the sample. Data are expressed as mean values ± S.D., n = 4 for each concentration.
FIGURE 7.
FIGURE 7.
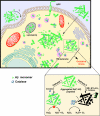
Schematic diagram of the proposed deactivation of catalase as a contributor of Aβ-induced oxidative stress. Cellular internalization of Aβ peptides via endocytotic and/or non-endocytotic pathways result in accumulation of Aβ within cells. The internalized Aβ can interact with proteins such as catalase present in the cytosol, peroxisomes, and other cellular organelles. The diagram of the expanded region illustrates the deactivation of the H2O2-degrading activity of catalase in the cytosol or peroxisomes (pathway 1). The BTA-EGx molecules, however, protect the activity of catalase by forming protein-resistant surface coatings on aggregated Aβ and inhibiting harmful intracellular catalase-amyloid interactions (pathway 2).

References

    1. Harman D. (1956) J. Gerontol. 11, 298–300 - PubMed
    1. Harman D. (1981) Proc. Natl. Acad. Sci. U.S.A. 78, 7124–7128 - PMC - PubMed
    1. Subbarao K. V., Richardson J. S., Ang L. C. (1990) J. Neurochem. 55, 342–345 - PubMed
    1. Mecocci P., MacGarvey U., Beal M. F. (1994) Ann. Neurol. 36, 747–751 - PubMed
    1. Hensley K., Hall N., Subramaniam R., Cole P., Harris M., Aksenov M., Aksenova M., Gabbita S. P., Wu J. F., Carney J. M., Lovell M., Markesbery W. R., Butterfield D. A. (1995) J. Neurochem. 65, 2146–2156 - PubMed

Publication types

MeSH terms

LinkOut - more resources