. 2010 Dec 10;285(50):38923-32.
doi: 10.1074/jbc.M110.172304. Epub 2010 Oct 5.

Thrombospondin-1 inhibits VEGF receptor-2 signaling by disrupting its association with CD47

Affiliations

Thrombospondin-1 inhibits VEGF receptor-2 signaling by disrupting its association with CD47

Sukhbir Kaur et al. J Biol Chem. .

Abstract

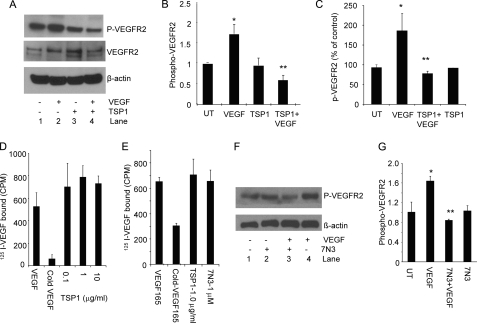
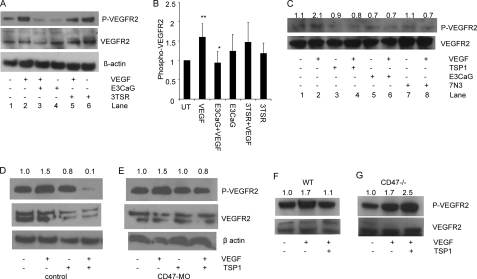
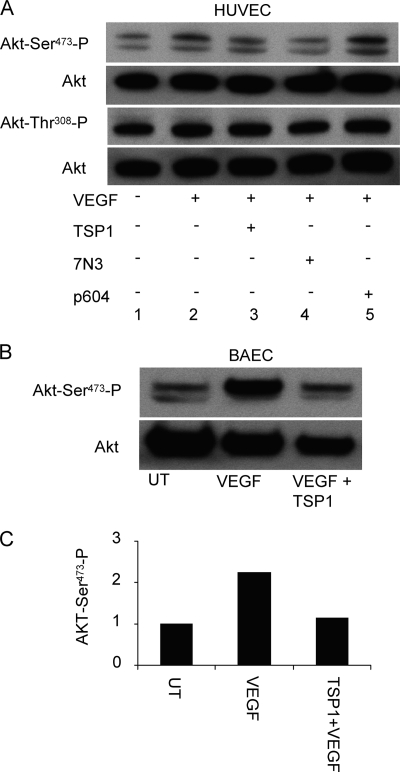
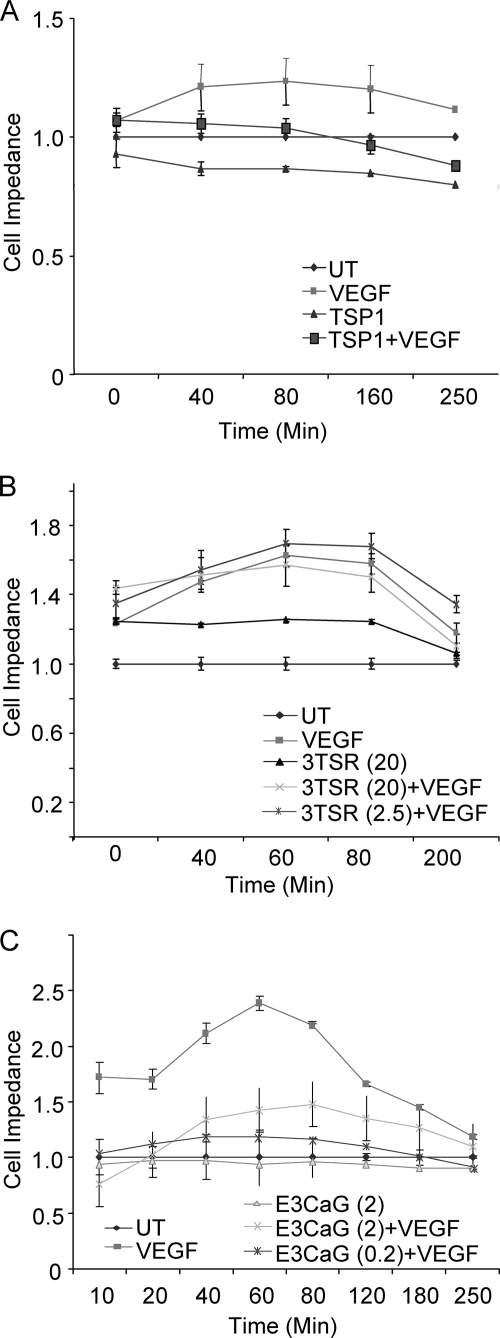
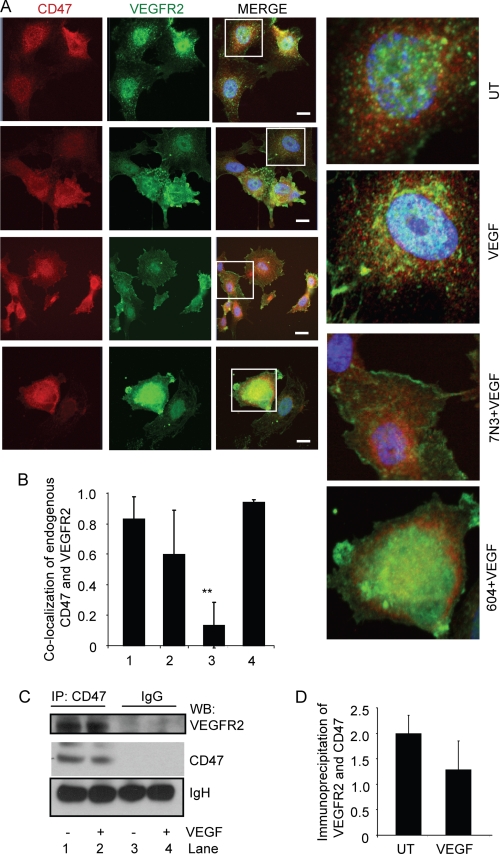
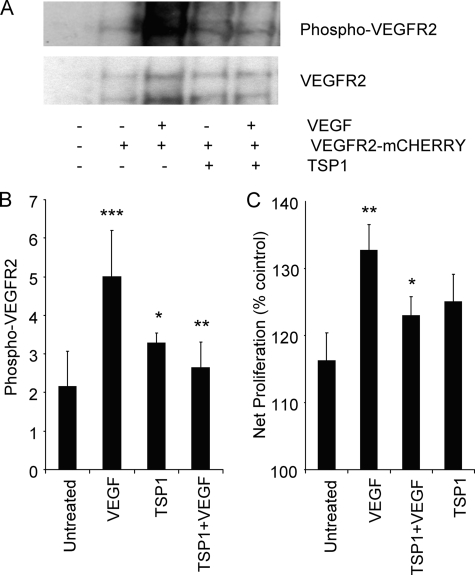
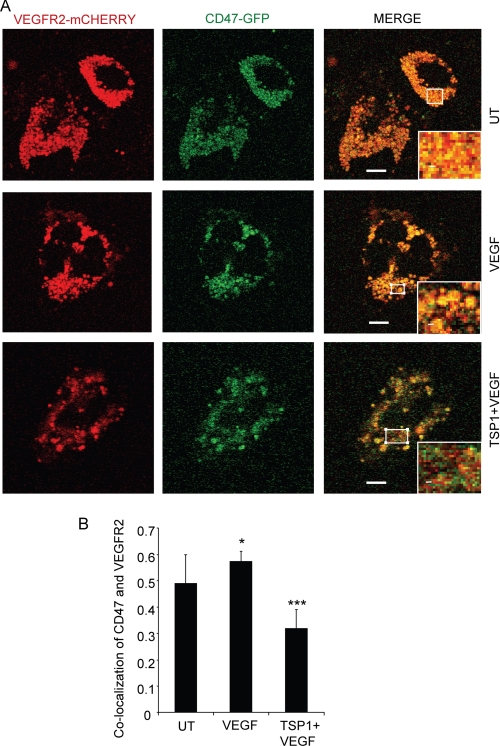
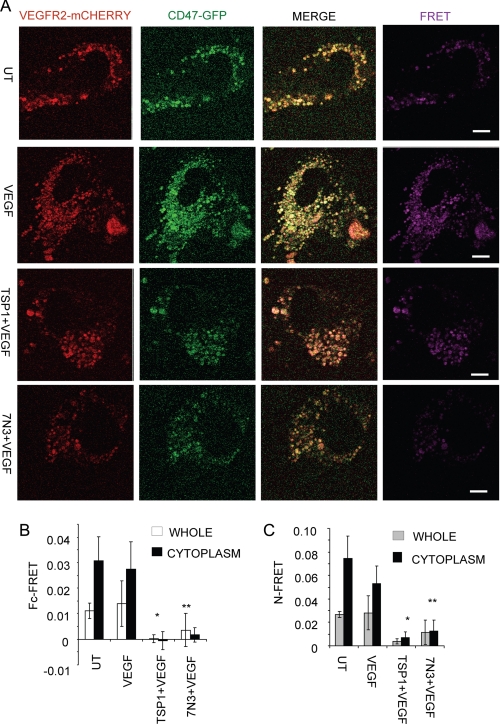
Thrombospondin-1 (TSP1) can inhibit angiogenic responses directly by interacting with VEGF and indirectly by engaging several endothelial cell TSP1 receptors. We now describe a more potent mechanism by which TSP1 inhibits VEGF receptor-2 (VEGFR2) activation through engaging its receptor CD47. CD47 ligation is known to inhibit downstream signaling targets of VEGFR2, including endothelial nitric-oxide synthase and soluble guanylate cyclase, but direct effects on VEGFR2 have not been examined. Based on FRET and co-immunoprecipitation, CD47 constitutively associated with VEGFR2. Ligation of CD47 by TSP1 abolished resonance energy transfer with VEGFR2 and inhibited phosphorylation of VEGFR2 and its downstream target Akt without inhibiting VEGF binding to VEGFR2. The inhibitory activity of TSP1 in large vessel and microvascular endothelial cells was replicated by a recombinant domain of the protein containing its CD47-binding site and by a CD47-binding peptide derived from this domain but not by the CD36-binding domain of TSP1. Inhibition of VEGFR2 phosphorylation was lost when CD47 expression was suppressed in human endothelial cells and in murine CD47-null cells. These results reveal that anti-angiogenic signaling through CD47 is highly redundant and extends beyond inhibition of nitric oxide signaling to global inhibition of VEGFR2 signaling.


Figures

FIGURE 1.
FIGURE 1.
TSP1 and a CD47-binding peptide inhibit VEGFR2 signaling without inhibiting VEGF binding. A, TSP1 suppresses VEGFR2 phosphorylation. A representative Western blot is shown using anti-Tyr1175 VEGFR2 and anti-VEGFR2 antibodies with lysates from untreated BAEC (lane 1) and BAEC stimulated with VEGF (30 ng/ml) for 5 min (lane 2), treated with TSP1 (2 nm) alone (lane 3), and pretreated with TSP1 (2 nm) followed by VEGF (30 ng/ml) for 5 min (lane 4). B, quantification of VEGFR2 phosphorylation in three independent experiments normalized to loading controls. p values were as follows: VEGF versus untreated (UT), 0.00007 (*); and VEGF versus TSP1 + VEGF, 0.0001 (**). C, inhibition of VEGFR2 phosphorylation by TSP1 in HDMVEC (quantification of two independent experiments). p values were as follows: untreated versus VEGF, 0.09 (*); VEGF versus TSP1 + VEGF, 0.07 (**); VEGF versus TSP1, 0.08; and untreated versus TSP1, 0.7. D, iodinated VEGF binding to BAEC was assessed in the presence of the indicated concentrations of TSP1 or in the presence of a 200-fold excess of unlabeled VEGF. E, TSP1 and 7N3 inhibition of VEGF binding to BAEC. F, inhibition of VEGFR2 phosphorylation by peptide 7N3. Lane 1, untreated; lane 2, 7N3 (1 μm) alone; lane 3, 7N3 (1 μm) and VEGF (30 ng/ml); lane 4, VEGF (30 ng/ml)-stimulated. G, quantification of three independent experiments. p values were as follows: untreated versus VEGF; 0.007 (*); and VEGF versus 7N3 + VEGF, 0.012 (**).
FIGURE 2.
FIGURE 2.
CD47 is necessary for inhibition of VEGFR2 signaling. A, TSP1 mediates suppression via its CD47-binding domain but not via its CD36-binding domain. Lane 1, untreated; lane 2, VEGF (30 ng/ml)-treated; lane 3, E3CaG (2 nm) + VEGF (30 ng/ml); lane 4, E3CaG (2 nm) alone; lane 5, 3TSR (2 nm) + VEGF (30 ng/ml); lane 6, 3TSR alone (2 nm). B, quantification of three independent experiments. p values were as follows: untreated (UT) versus VEGF; 0.01 (**); VEGF versus E3CaG + VEGF, 0.02 (*); and VEGF versus 3TSR + VEGF. 0.10. C, VEGFR2 Tyr1175 phosphorylation was assessed in unstimulated HDMVEC (lane 1) and in cells stimulated with VEGF (30 ng/ml) for 5 min (lane 2), treated with TSP1 (2 nm) alone (lane 3), pretreated with TSP1 (2 nm) and stimulated with VEGF (30 ng/ml) for 5 min (lane 4), treated with E3CaG (2 nm) alone (lane 5), pretreated with E3CaG and stimulated with VEGF for 5 min (lane 6), treated with peptide 7N3 (1 μm) alone (lane 7), and pretreated with peptide 7N3 and stimulated with VEGF for 5 min (lane 8). Numbers represent densitometry for phospho-VEGFR2/total VEGFR2 normalized to 1.0 for untreated cells. D and E, TSP1 does not suppress VEGFR2 phosphorylation after CD47 knockdown in HUVEC. D, control HUVEC (first lane) and HUVEC treated with VEGF (30 ng/ml) (second lane), TSP1 (2 nm) (third lane), TSP1 (2 nm) + VEGF (30 ng/ml) (fourth lane). E, CD47 morpholino (MO)-treated HUVEC left untreated (first lane) or treated with VEGF (30 ng/ml) (second lane), TSP1 (2 nm) (third lane), and TSP1 (2 nm) + VEGF (fourth lane). Numbers represent densitometric analysis of the phospho-VEGFR2 signal normalized to 1.0 for untreated cells. F and G, primary murine lung endothelial cells from wild-type and CD47-null mice were treated with VEGF in the absence or presence of TSP1 and analyzed by Western blotting for VEGFR2 phosphorylation. Numbers represent densitometric analysis of the phospho-VEGFR2 signal.
FIGURE 3.
FIGURE 3.
CD47 ligation inhibits VEGF-induced activation of Akt. A, TSP1 regulates phosphorylation of Akt at Ser473 via CD47 in HUVEC. Lane 1, untreated cells; lane 2, VEGF-stimulated; lane 3, TSP1 (2 nm) + VEGF (30 ng/ml) treatment; lane 4, peptide 7N3 (1 μm) + VEGF (30 ng/ml) treatment; lane 5, control peptide 604 (1 μm) + VEGF (30 ng/ml) treatment. B, suppression of phosphorylation of Akt at Ser473 by TSP1 in BAEC. First lane 1, untreated (UT); second lane, VEGF-stimulated; third lane, TSP1/VEGF-treated. C, quantification of Akt phosphorylation in BAEC (one representative experiment).
FIGURE 4.
FIGURE 4.
The CD47-binding domain of TSP1 inhibits VEGF-stimulated endothelial cell adhesion. A, changes in cell spreading and adhesive contact with the substrate were assessed by impedance and are presented as a normalized cell index. Cells were treated with VEGF (30 ng/ml) in the absence or presence of TSP1 (2 nm), and impedance was quantified for 4 h. B, cells were treated with VEGF in the presence of the indicated concentrations of the recombinant CD36-binding domain of TSP1 (3TSR; 2.5–20 nm). C, cells were stimulated with VEGF in the presence of the indicated concentrations of the recombinant CD47-binding domain of TSP1 (E3CaG; 0.2–2 nm). UT, untreated.
FIGURE 5.
FIGURE 5.
Endogenous CD47 interacts with VEGFR2. A, untreated (UT) HUVEC or HUVEC treated for 5 min with 30 ng/ml VEGF alone or following a 5-min pretreatment with 1 μm CD47-binding peptide 7N3 or control peptide 604. The cells were fixed 5 min after the addition of VEGF and stained with antibodies to visualize endogenous CD47 (red) and VEGFR2 (green). Scale bars = 10 μm. B, quantitative analysis of co-localization. Bar 1, untreated HUVEC; bar 2, HUVEC stimulated with VEGF (30 ng/ml) for 5 min; bar 3, HUVEC simulated with peptide 7N3 (1 μm) + VEGF (30 ng/ml) p < 0.05 (**); bar 4, HUVEC simulated with VEGF (30 ng/ml) + control peptide 604 (1 μm). C, co-immunoprecipitation of endogenous VEGFR2 with CD47 in HUVEC. Lanes 1 and 3, untreated; lanes 2 and 4, VEGF-treated. Lanes 1 and 2 were immunoprecipitated (IP) using an anti-CD47 antibody, and lanes 3 and 4 were immunoprecipitated using control IgG. A representative blot is shown. D, quantification of three independent Western blots (WB).
FIGURE 6.
FIGURE 6.
Functional analysis of VEGFR2-mCherry expressed in NIH3T3 cells. A, phosphorylation of VEGFR2-mCherry in response to VEGF and inhibition by TSP1. A representative Western blot is shown for untransfected 3T3 cells (first lane); untreated 3T3 cells expressing VEGFR2-mCherry (second lane); and 3T3 cells expressing VEGFR2-mCherry treated with VEGF (30 ng/ml) (third lane), treated with TSP1 (2 nm) alone (fourth lane), and pretreated with TSP1 (2 nm) followed by VEGF (30 ng/ml) (fifth lane). B, quantification of Western blots from three independent experiments. p values were as follows: untransfected versus transfected and untreated; 0.1; untreated versus VEGF, 0.006 (***); VEGF versus TSP1 + VEGF, 0.02 (**); VEGF versus TSP1, 0.07 (*); and untreated versus TSP1 + VEGF, 0.07. C, TSP1 inhibits VEGF-induced cell proliferation of NIH3T3 cells expressing VEGFR2-mCherry p < 0.05 (*). Cell proliferation was quantified using MTS reagent (n = 3).
FIGURE 7.
FIGURE 7.
TSP1 inhibits co-localization of CD47-GFP and VEGFR2-mCherry in live endothelial cells. A, CD47 and VEGFR2 co-localization is inhibited by TSP1. HUVEC were transiently transfected with plasmids encoding VEGFR2-mCherry and CD47-GFP and preincubated as indicated with 1 μg/ml TSP1 (2.2 nm) for 20 min before treatment for 5 min with 30 ng/ml VEGF. Images were acquired using live cells. Red, VEGFR2-mCherry; green, CD47-GFP. B, quantification of CD47 and VEGFR2 co-localization. p value were as follows: untreated (UT) versus VEGF, 0.1; untreated versus TSP1 + VEGF, 0.07 (*); and VEGF versus TSP1 + VEGF, 0.0001 (***). Scale bars = 10 μm.
FIGURE 8.
FIGURE 8.
CD47 ligation inhibits FRET between CD47 and VEGFR2. A, representative FRET images between CD47 and VEGFR2. HUVEC were transiently transfected to express VEGFR2-mCherry (red) and CD47-GFP (green). Cells were pretreated with 1 μg/ml (2.2 nm) TSP1 as indicated for 20 min before the addition of VEGF. Live cells were imaged 5 min after the addition of VEGF. Right panels (purple), FRET. UT, untreated. B, quantification of whole cells and cytoplasm by Fc-FRET. C, quantification of whole cells and cytoplasm by N-FRET. p values for Fc-FRET were as follows: VEGF versus TSP1 + VEGF, 0.00050 (*); and VEGF versus peptide 7N3 + VEGF, 0.000013 (**). p values for N-FRET were as follows: VEGF versus TSP1 + VEGF, 0.00017 (*); and VEGF versus peptide 7N3 + VEGF, 0.000036 (**). Scale bars = 10 μm.

References

    1. Ku D. D., Zaleski J. K., Liu S., Brock T. A. (1993) Am. J. Physiol. 265, H586–H592 - PubMed
    1. Shibuya M. (2006) J. Biochem. Mol. Biol. 39, 469–478 - PubMed
    1. Lee S., Chen T. T., Barber C. L., Jordan M. C., Murdock J., Desai S., Ferrara N., Nagy A., Roos K. P., Iruela-Arispe M. L. (2007) Cell 130, 691–703 - PMC - PubMed
    1. Curwen J. O., Musgrove H. L., Kendrew J., Richmond G. H., Ogilvie D. J., Wedge S. R. (2008) Clin. Cancer Res. 14, 3124–3131 - PubMed
    1. Grothey A., Galanis E. (2009) Nat. Rev. Clin. Oncol. 6, 507–518 - PubMed

Publication types