. 2011 Feb;39(3):808-24.
doi: 10.1093/nar/gkq710. Epub 2010 Oct 4.

Theoretical and empirical quality assessment of transcription factor-binding motifs

Affiliations

Theoretical and empirical quality assessment of transcription factor-binding motifs

Alejandra Medina-Rivera et al. Nucleic Acids Res. 2011 Feb.

Abstract

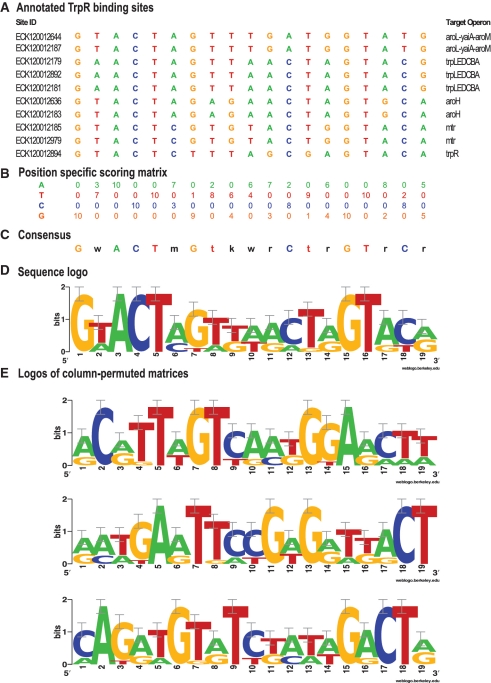
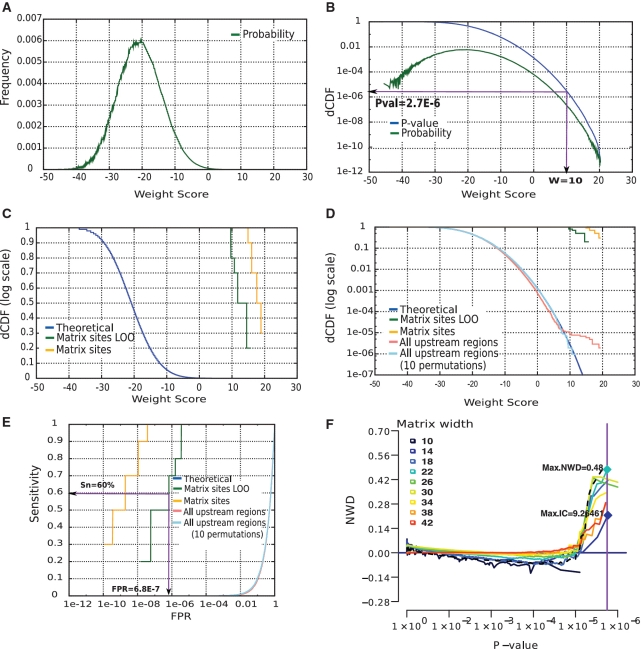
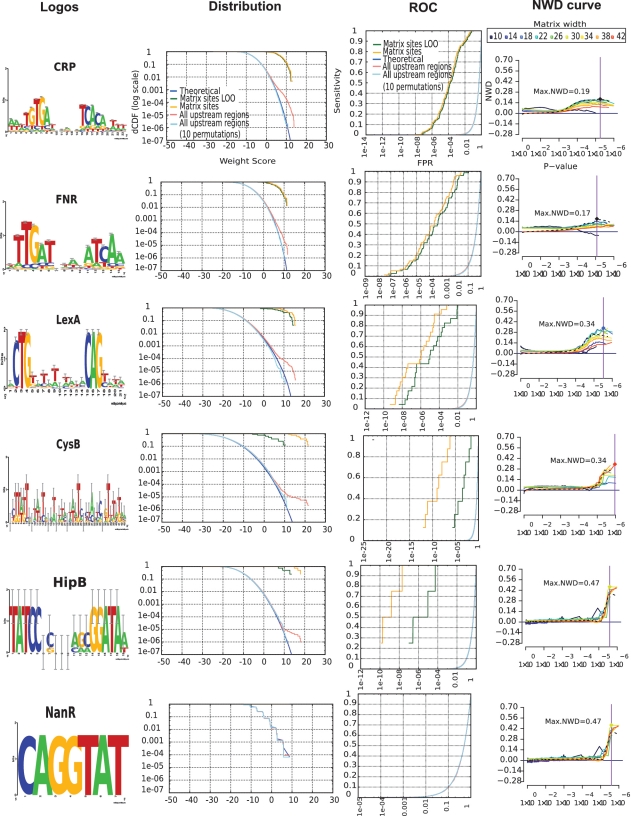
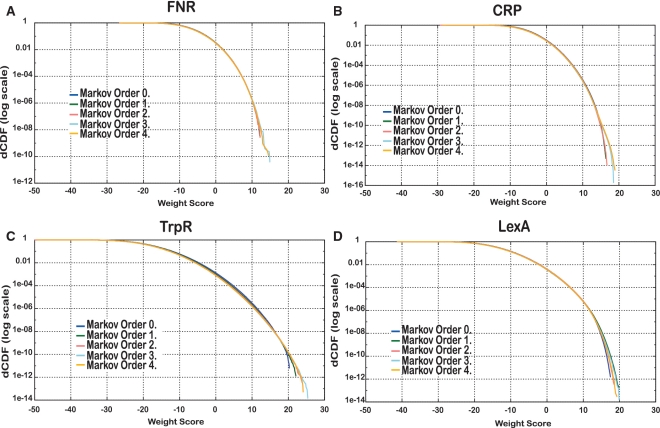
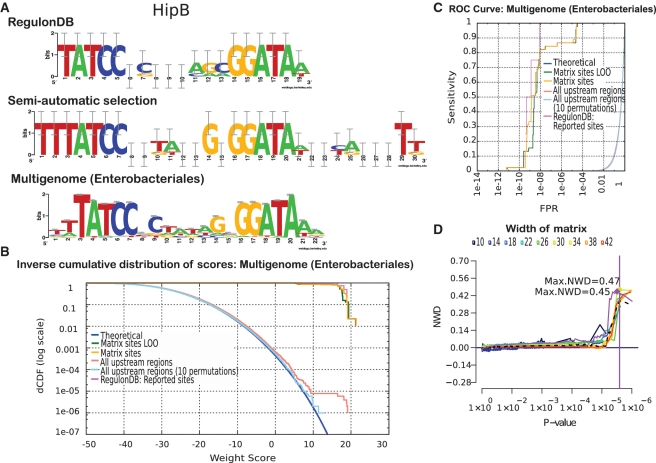
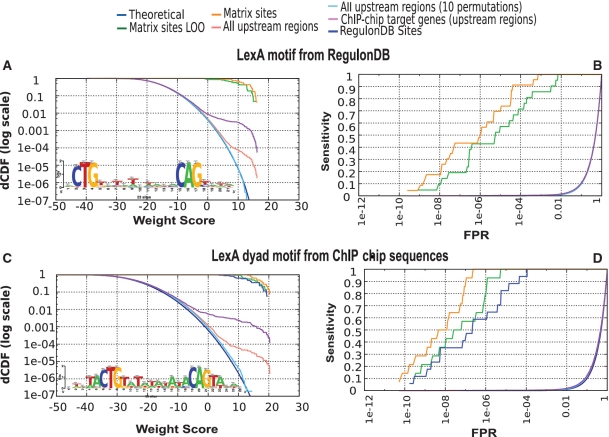
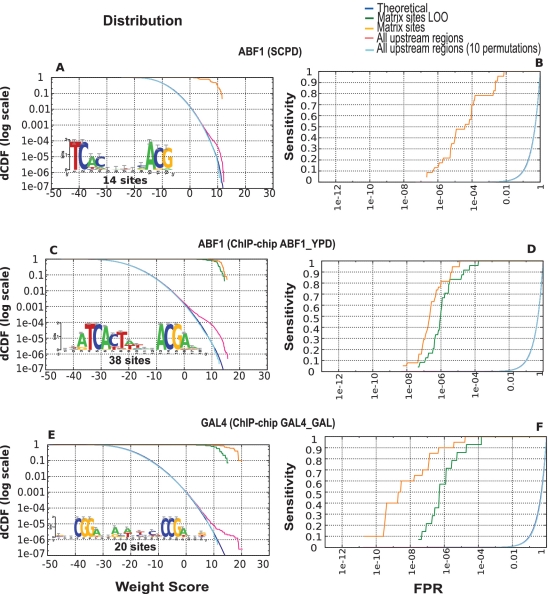
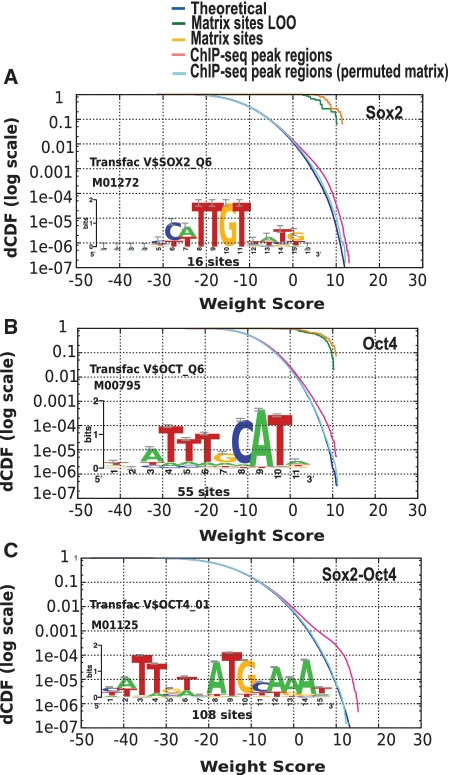
Position-specific scoring matrices (PSSMs) are routinely used to predict transcription factor (TF)-binding sites in genome sequences. However, their reliability to predict novel binding sites can be far from optimum, due to the use of a small number of training sites or the inappropriate choice of parameters when building the matrix or when scanning sequences with it. Measures of matrix quality such as E-value and information content rely on theoretical models, and may fail in the context of full genome sequences. We propose a method, implemented in the program 'matrix-quality', that combines theoretical and empirical score distributions to assess reliability of PSSMs for predicting TF-binding sites. We applied 'matrix-quality' to estimate the predictive capacity of matrices for bacterial, yeast and mouse TFs. The evaluation of matrices from RegulonDB revealed some poorly predictive motifs, and allowed us to quantify the improvements obtained by applying multi-genome motif discovery. Interestingly, the method reveals differences between global and specific regulators. It also highlights the enrichment of binding sites in sequence sets obtained from high-throughput ChIP-chip (bacterial and yeast TFs), and ChIP-seq and experiments (mouse TFs). The method presented here has many applications, including: selecting reliable motifs before scanning sequences; improving motif collections in TFs databases; evaluating motifs discovered using high-throughput data sets.


Figures

Figure 1.
Figure 1.
TrpR PSSM annotated in RegulonDB and permutation examples. (A) Collection of experimentally characterized binding sites for the TF TrpR of E. coli K12. (B) Count matrix, indicating the occurrences of each residue (row) at each position (column) of the aligned binding sites. (C) Degenerate consensus derived from the matrix (obtained with the RSAT program ‘convert-matrix’). (D) Sequence logo obtained with the program ‘seqlogo’ (40). (E) Three examples of column-permuted matrices used for the negative controls (logo representation).
Figure 2.
Figure 2.
Theoretical and empirical score distributions for the TrpR matrix. (A) Theoretical density function showing the probability (ordinate) associated to each WS value (abscissa). In this figure, the theoretical score distribution was estimated with a Bernoulli model calibrated using the whole set of upstream non-coding sequences of E. coli K12. (B) Decreasing cumulative distribution function (dCDF, blue curve) derived from the density function (green curve in A). Abscissa represents the WS assigned by the matrix. Note that the Y-axis is in log-scale, in order to emphasize small frequencies. (C) Score distributions in the annotated binding sites. Orange: biased scores assigned by the matrix to the annotated binding sites. Green: unbiased scores obtained with a LOO procedure. Blue: theoretical distribution (P-value). (D) Empirical score distribution observed in the whole set of upstream non-coding sequences for the TrpR matrix (pink) and 10 matrices randomized by column permutations (cyan). The logarithmic Y-axis highlights the relevant range of P-values (small values). (E) The ROC curve shows the difference between the biased and LOO validations. The ordinate indicates the sensitivity (fraction of sites detected), the abscissa shows the corresponding FPR. Note the logarithmic X-axis, which is essential to highlight the relevant FPR range (small values). (F) NWD curves for matrices of different widths built from annotated TrpR-binding sites. The dotted line corresponds to the RegulonDB matrix.
Figure 3.
Figure 3.
Sequence logos and score distributions for a selection of representative TFs. Each row corresponds to one TF, indicated in the left column. (First column) Sequence logos. (Second column) Score distributions. (Third column) ROC curves displayed with a logarithmic scale on the abscissa (FPR). (Fourth column) Score difference curves to compare alternative matrices for the same TF. Each curve represents the score differences (abscissa) between positive and negative sets, for different P-values (ordinate).
Figure 4.
Figure 4.
Impact of the background model on the theoretical score distribution for four matrices annotated in RegulonDB. For each factor, the theoretical weight distribution was computed using Markov models of various orders (from 0 to 4) estimated from k-mer frequencies measured in all upstream regions of E. coli K12. (A) FNR. (B) CRP. (C) TrpR. (D) LexA.
Figure 5.
Figure 5.
Motif discovered by ‘footprint-discovery’ in the promoters of 14 hipB orthologs (Enterobacteriales). (A) Sequence logos from different matrices representing the binding motif for the TF HipB. (B) P-value distribution for the multi-genome matrix. (C) ROC curves for the multi-genome matrix. (D) Quality comparison of different matrices based on NWD distributions. Dotted curve: RegulonDB matrix. Light mauve: multi-genome matrix. Other curves: matrices of various widths built from the 4 HipB sites annotated in RegulonDB. Note the abrupt step in the light mauve curve, indicating the discriminant power of the multigenome matrix.
Figure 6.
Figure 6.
Analysis of LexA target genes detected by a ChIP-chip experiment. (A) Score distributions showing the enrichment of putative LexA-binding sites in the target promoters detected by ChIP–chip. Sites were predicted with the LexA matrix from RegulonDB. (B) ROC curve of the LexA matrix available in RegulonDB. (C) Score distributions of a LexA PSSM resulting from pattern discovery (‘dyad-analysis’) in the LexA target genes detected by ChIP–chip. (D) ROC curve of the matrix discovered with ‘dyad-analysis’.
Figure 7.
Figure 7.
Matrices obtained from motif discovery in yeast promoters selected by ChIP-chip experiments. Score distribution and ROC curves for the ABF1 matrix annotated in SCPD (A and B), an ABF1 matrix discovered in promoters selected by ChIP-chip (C and D) and a GAL4 matrix discovered in promoters selected by ChIP-chip (E and F).
Figure 8.
Figure 8.
Enrichment of putative binding sites for mouse TFs in peak sequences detected by ChIP–seq experiments. Score distributions in peak regions detected by a Sox2 ChIP–seq experiment, analyzing motifs for Sox2 (A), Oct4 (B) and Sox2-Oct4 (C).

References

    1. Salgado H, Gama-Castro S, Peralta-Gil M, Diaz-Peredo E, Sanchez-Solano F, Santos-Zavaleta A, Martinez-Flores I, Jimenez-Jacinto V, Bonavides-Martinez C, Segura-Salazar J, et al. RegulonDB (version 5.0): Escherichia coli K-12 transcriptional regulatory network, operon organization, and growth conditions. Nucleic Acids Res. 2006;34:D394–D397. - PMC - PubMed
    1. Huerta AM, Salgado H, Thieffry D, Collado-Vides J. RegulonDB: a database on transcriptional regulation in Escherichia coli. Nucleic Acids Res. 1998;26:55–59. - PMC - PubMed
    1. Knuppel R, Dietze P, Lehnberg W, Frech K, Wingender E. TRANSFAC retrieval program: a network model database of eukaryotic transcription regulating sequences and proteins. J. Comput. Biol. 1994;1:191–198. - PubMed
    1. Wingender E. TRANSFAC, TRANSPATH and CYTOMER as starting points for an ontology of regulatory networks. In Silico Biol. 2004;4:55–61. - PubMed
    1. Montgomery SB, Griffith OL, Sleumer MC, Bergman CM, Bilenky M, Pleasance ED, Prychyna Y, Zhang X, Jones SJ. ORegAnno: an open access database and curation system for literature-derived promoters, transcription factor binding sites and regulatory variation. Bioinformatics. 2006;22:637–640. - PubMed

Publication types