Review
. 2011 Mar-Apr;17(2):141-58.
doi: 10.1093/humupd/dmq040. Epub 2010 Oct 5.

Types of ovarian activity in women and their significance: the continuum (a reinterpretation of early findings)

Affiliations
Review

Types of ovarian activity in women and their significance: the continuum (a reinterpretation of early findings)

James B Brown. Hum Reprod Update. 2011 Mar-Apr.

Abstract

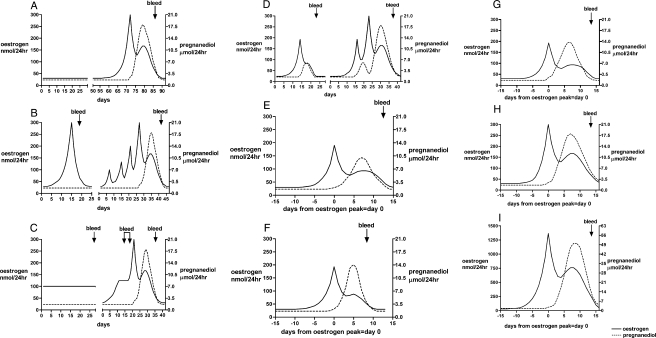
Background: There are many types of ovarian activity that occur in women. This review provides information on the relationship between the hormone values and the degree of biological response to the hormones including the frequency and degree of uterine bleeding. The continuous process is termed the 'Continuum' and is thus similar to other processes in the body.

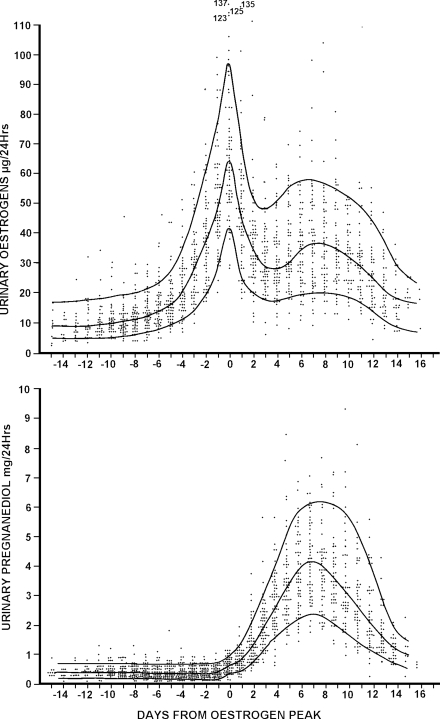
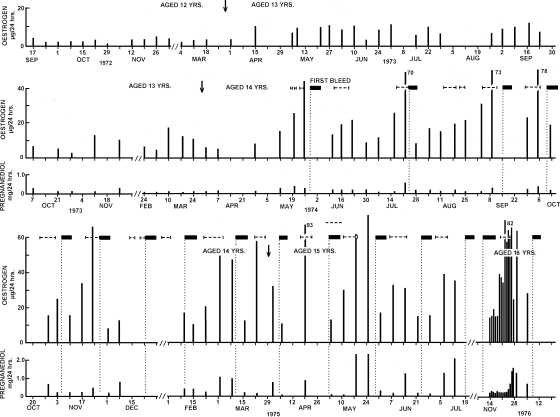
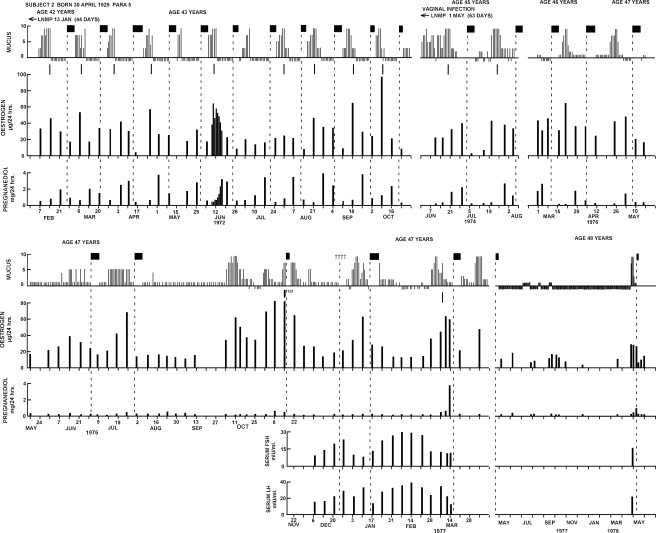
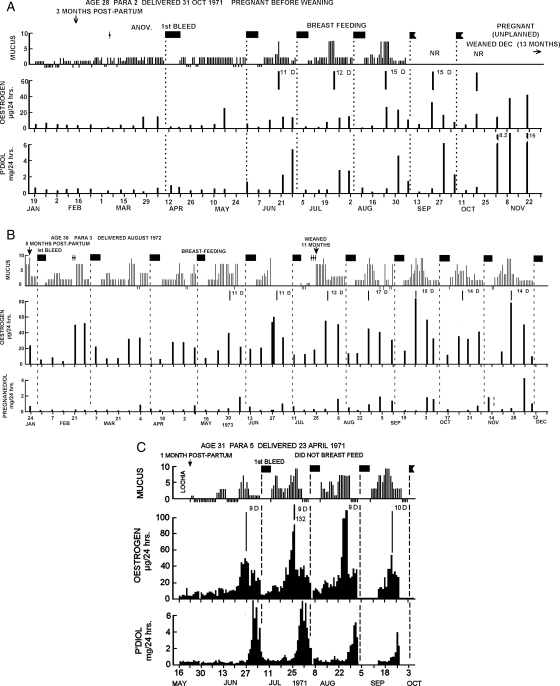
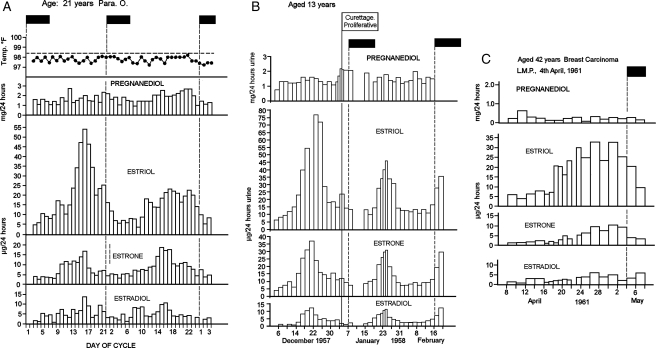
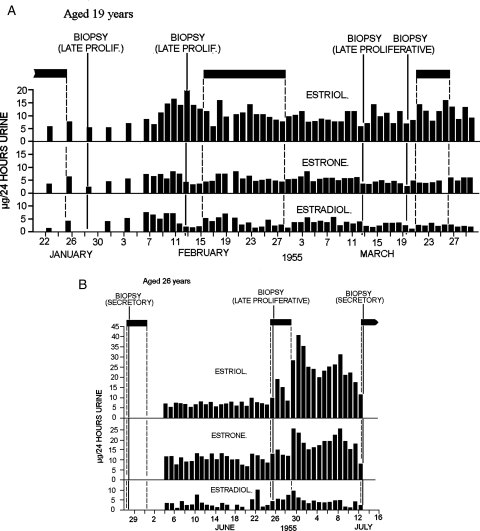
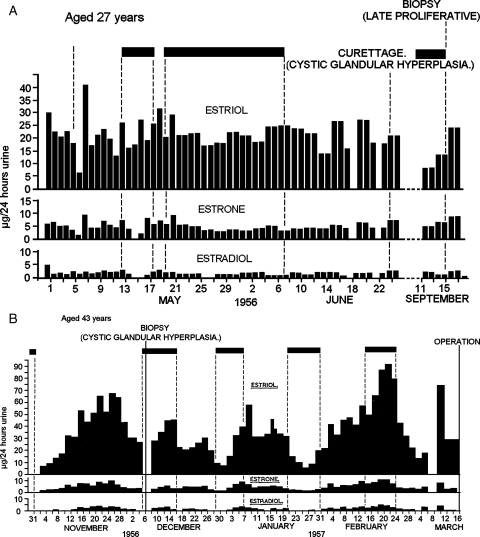
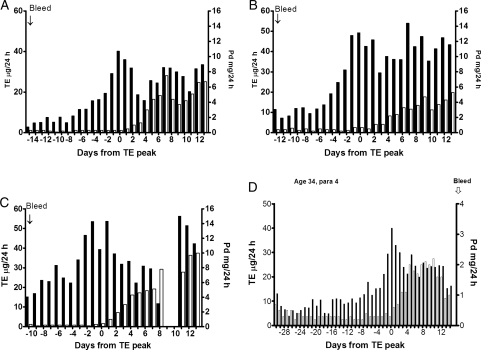
Methods: This review draws on information already published from monitoring ovarian activity by urinary oestrogen and pregnanediol measurements using timed 24-h specimens of urine. Much of the rationalization was derived from 5 to 6 year studies of girls progressing from childhood to adulthood, women progressing through menopause, and the return of fertility post-partum. During these times, all the reported types of ovarian activity were encountered.

Results: All cycle types can be understood in terms of steps in the normal maturation of fertility at the beginning of reproductive life, its return post-partum and its demise at menopause. Each step merges into the next and therefore the sequence is termed the 'Continuum'. Unpredictable movement from fertile to infertile types and back can occur at any time during reproductive life. Stress is a major causative factor. Hormonal definitions for each step, the relevance of the various cycle types in determining fertility and in the initiation of uterine bleeding and the roles of the pituitary hormones in causing them, are presented.

Conclusions: The findings explain the erratic fertility of women and why ovulation is not always associated with fertility. They provide an understanding of the various types of ovarian activity and their relation to pituitary function, fertility and uterine bleeding.


Figures

Figure 1
Figure 1
Daily TE and pregnanediol values in 61 ovulatory menstrual cycles from 26 parous and 14 nulliparous women aged 20–40 years. All values are plotted and the 10th, 50th and 90th percentile lines are shown. The ovulatory oestrogen peak was identified in every cycle and the days are numbered from this day (=day 0). Reprinted with permission from Brown et al. (1981). Copyright Advocate Press and Ovulation Method Research and Reference Centre of Australia, Melbourne.
Figure 2
Figure 2
Weekly TE and pregnanediol values in a girl measured over 4 years from age 12 to 16 years. Menarche and first ovulation were documented. Arrow denotes birthdays; filled boxes denote vaginal bleeding, vertical dotted lines show day of bleeding, horizontal dotted lines denote production of fertile type cervical mucus. [Reprinted with permission from Brown et al. (1978). Copyright Cambridge University Press].
Figure 3
Figure 3
Weekly TE and pregnanediol values and daily mucus scores recorded over a period of 6 years in a woman between the ages of 42 and 48 years as she approached menopause. Weekly serum LH and FSH values were measured between December, 1976 and March, 1977. The short vertical lines under the mucus scores are the best estimates of the times of ovulation. Filled boxes denote bleeding; plusses symbols denote spotting. Note that the ovulatory mechanism began to fail before the follicular activity. Reprinted with permission from Brown et al. (1981) Copyright Advocate Press and Ovulation Method Research and Reference Centre of Australia, Melbourne.
Figure 4
Figure 4
Weekly TE and pregnanediol values, daily mucus scores and episodes of bleeding during the return of fertility after child-birth and during lactation. The vertical dotted lines show the day of bleeding and the solid vertical lines under the mucus represent the best estimate of the day of ovulation. Filled boxes denote bleeding; NR, no record. (A) Fertile cycles recommenced in June and conception occurred in October. (B) A similar figure showing that the return of the ovulatory mechanism came after the commencement of follicular activity as in Fig. 2. (C) This subject did not breastfeed and ovulatory cycles with short luteal phases commenced 2 months after delivery. Reprinted with permission from Brown et al. (1985) Copyright Cambridge University Press.
Figure 5
Figure 5
(A) Daily oestriol, oestrone and oestradiol and pregnanediol values, and basal body temperature, during two anovulatory cycles of the fluctuating oestrogen type, one with a sharp TE peak and the other with a broad TE peak. The pregnanediol values were obtained by the colorimetric method of Klopper et al. (1955) and included a small urine blank. (B) Two anovulatory cycles with sharp oestrogen peaks. (C) Results from another woman showing a broad anovulatory oestrogen peak. Filled boxes denote bleeding in all diagrams. Reprinted with permission from Brown and Matthew (1962) Copyright the Endocrine Society.
Figure 6
Figure 6
Daily oestriol, oestrone and oestradiol values, episodes of bleeding and results of endometrial biopsies during anovulatory ovarian activity of the constant oestrogen type. Filled boxes denote bleeding. (A) The TE values remained in the elevated range of 10–20 µg/24 h throughout the 3 months of the study and the biopsies showed late proliferative changes. (B) An anovulatory cycle sandwiched between two ovulatory cycles. The anovulatory bleeding occurred after the TE levels had been elevated between 15 and 20 µg/24 h for 22 days. This could be regarded as mid-cycle bleeding in an ovulatory cycle of 44 days duration. Note that the bleeding stopped as the oestrogen values rose to the ovulatory peak. Reprinted with permission from Brown and Matthew (1962). Copyright The Endocrine Society.
Figure 7
Figure 7
Daily oestriol, oestrone and oestradiol values, episodes of bleeding and results of endometrial biopsies in an anovulatory cycle of the constant oestrogen type (A) The TE values remained in the range of 20–40 µg/24 h and the biopsies showed either cystic glandular hyperplasia or late proliferative changes. (B) Two broad anovulatory oestrogen peaks with two ovulatory cycles between them and followed by another ovulatory cycle. The TE values reached 70–100 µg/24 h and were elevated for 2–3 weeks during the broad anovulatory peaks and the biopsies showed cystic glandular hyperplasia. Note that bleeding during two of the ovulatory cycles continued throughout the follicular phase and ceased at the oestrogen peaks. Filled boxes denote bleeding in all diagrams. Reprinted with permission from Brown and Matthew (1962). Copyright The Endocrine Society.
Figure 8
Figure 8
(A–C), show three conception cycles, (A) with a single oestrogen peak, which is the most common, and (B) and (C) with composite oestrogen peaks to show that such cycles are fertile. (C) Showed an early anovulatory oestrogen peak on Day-7. Note that all these conception cycles showed pregnanediol values exceeding 3 mg/24 h within 6 days of the oestrogen peak and all showed a fall by Day 10 as if the corpus luteum was regressing and was rescued by the developing pregnancies. (D) Shows a long cycle of 45 days with a deficient luteal phase, an oestrogen peak at the 10th percentile (40 µg/24 h) and an early anovulatory oestrogen peak on Day 24. The (pre-ovulatory) oestrogen peak day was Day 30.
Figure 9
Figure 9
Conceptualized cycles of the continuum. (A) Uniformly low TE and pregnanediol values denoting no ovarian activity and amenorrhoea. A fertile ovulatory cycle may follow spontaneously. (B) Anovulatory ovarian activity with a sharp oestrogen peak followed closely by oestrogen withdrawal bleeding. Days 30–70, a possible sequel, several anovulatory oestrogen peaks not followed by bleeding which might have been interpreted as ovulatory oestrogen peaks but recognized by absence of a progesterone rise and eventually followed by a fertile ovulation. (C) Days 1–30, anovulatory ovarian activity with constantly raised oestrogen excretion and oestrogen breakthrough bleeding. Days 30–70, possible sequel, situation correcting itself and progressing to a fertile ovulatory cycle, the oestrogen breakthrough bleeding then seen as mid-cycle bleeding. (D) Days 1–25, a sharp oestrogen peak followed by a LUF follicle followed by bleeding; the pregnanediol values rose temporally but did not reach 2 mg/24 h (9 µM/24 h). Days 30–70, possible sequel, a LUF not followed by bleeding but followed by a fertile ovulatory cycle. (E) Ovulation followed by a deficient luteal phase in which the pregnanediol values exceeded 2 mg/24 h (9 µM/24 h) but did not reach 3 mg/24 h (13.5 µM/24 h). Menstruation followed. (F) Ovulation followed by a short luteal phase of 10 days or less. The pregnanediol values usually exceed 3 mg/24 h but fall prematurely. Menstruation followed. (G) A fertile ovulatory cycle with hormone values at the 10th percentiles. (see Fig. 8). (H) A fertile ovulatory cycle with hormone values at the 50th percentiles. (I) An enhanced ovulatory cycle produced by gonadotrophin therapy.

References

    1. Alliende ME. Mean versus individual hormonal profiles in the menstrual cycle. Fertil Steril. 2002;78:90–95. doi:10.1016/S0015-0282(02)03167-9. - DOI - PubMed
    1. Baerwald AR, Adams GP, Pierson MS. A new model for ovarian follicular development during the human menstrual cycle. Fertil Steril. 2003;80:116–122. doi:10.1016/S0015-0282(03)00544-2. - DOI - PubMed
    1. Baird DT, Fraser IS. Blood production and ovarian secretion rates of estradiol-17ß and estrone in women throughout the menstrual cycle. J Clin Endocrinol Metab. 1974;38:1009–1017. doi:10.1210/jcem-38-6-1009. - DOI - PubMed
    1. Baird DT, Horton R, Longcope C, Tait JF. Steroid dynamics under steady state conditions. Rec Progr Horm Res. 1969;25:611–656. - PubMed
    1. Baird DD, Weinberg CR, Zhou H, Kamel F, McConnaughey DR, Kesner JS, Wilcox AJ. Preimplantation urinary hormone profiles and the probability of conception in healthy women. Fertil Steril. 1999;71:40–49. doi:10.1016/S0015-0282(98)00419-1. - DOI - PubMed

Publication types