. 2010 Oct;22(10):3439-60.
doi: 10.1105/tpc.110.077453. Epub 2010 Oct 5.

The Arabidopsis thylakoid protein PAM68 is required for efficient D1 biogenesis and photosystem II assembly

Affiliations

The Arabidopsis thylakoid protein PAM68 is required for efficient D1 biogenesis and photosystem II assembly

Ute Armbruster et al. Plant Cell. 2010 Oct.

Abstract

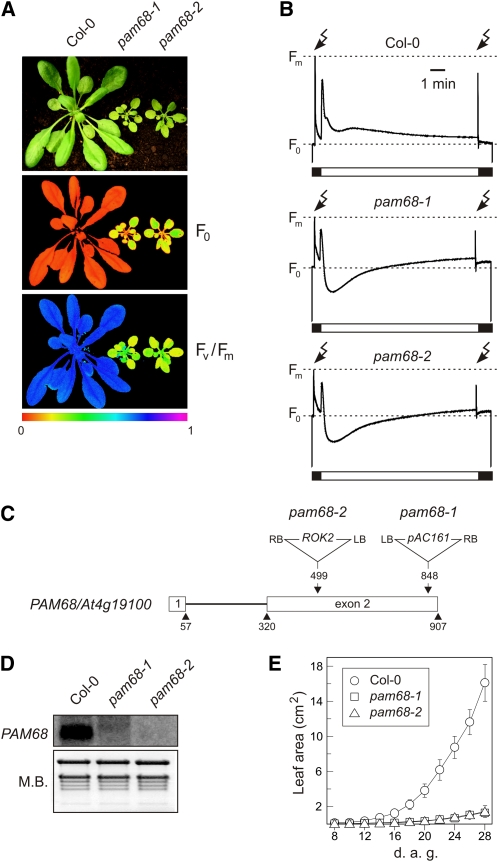
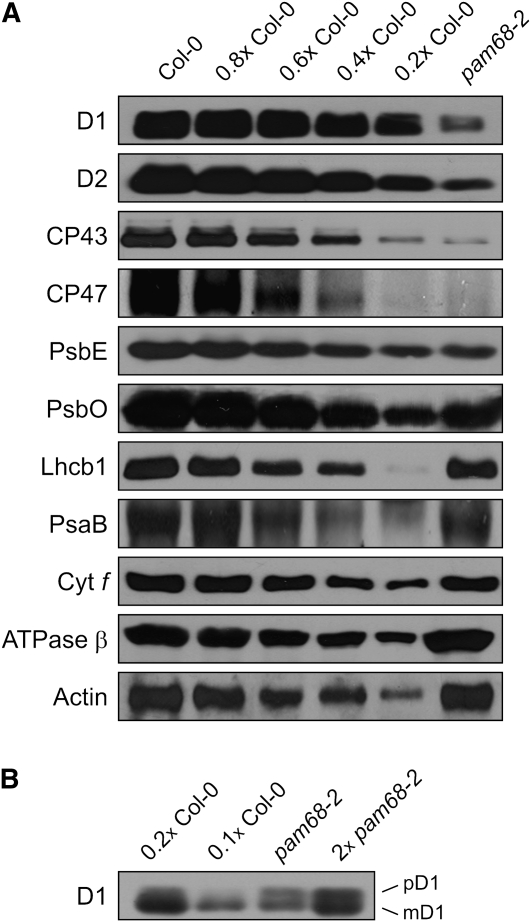
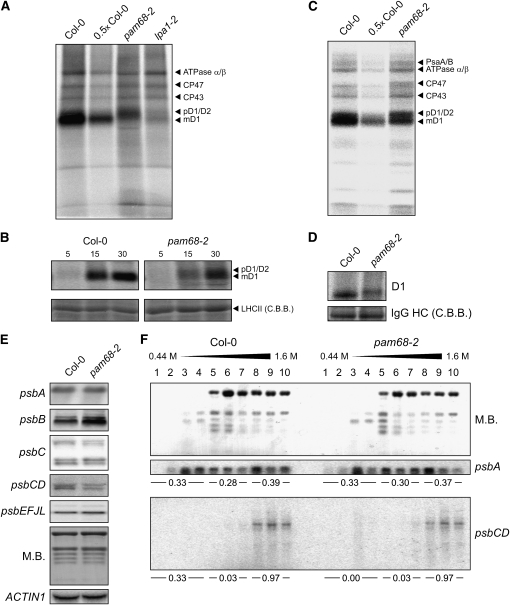
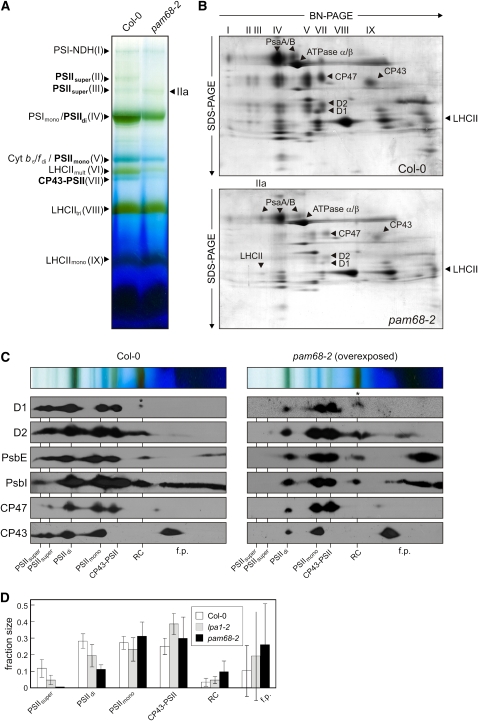
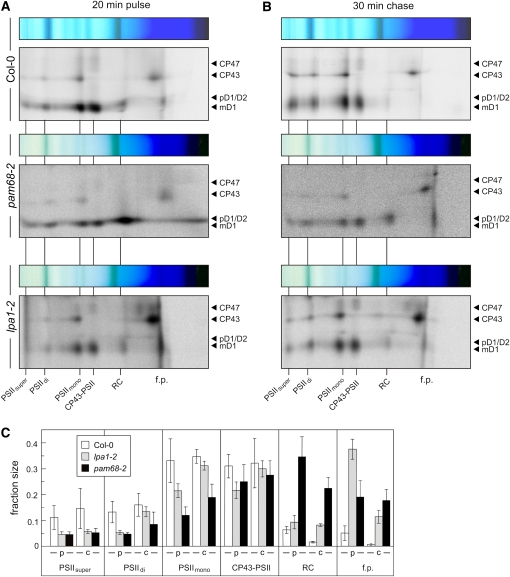
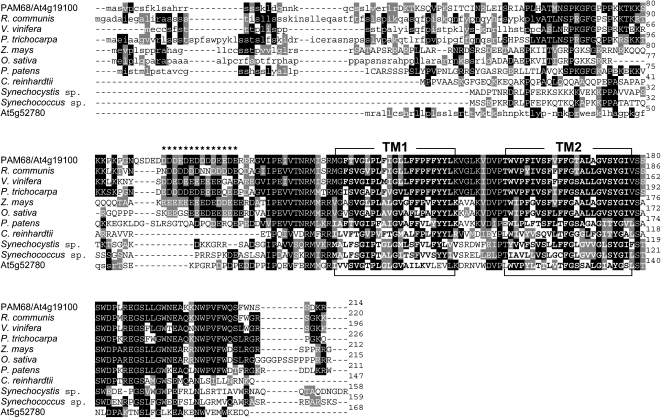
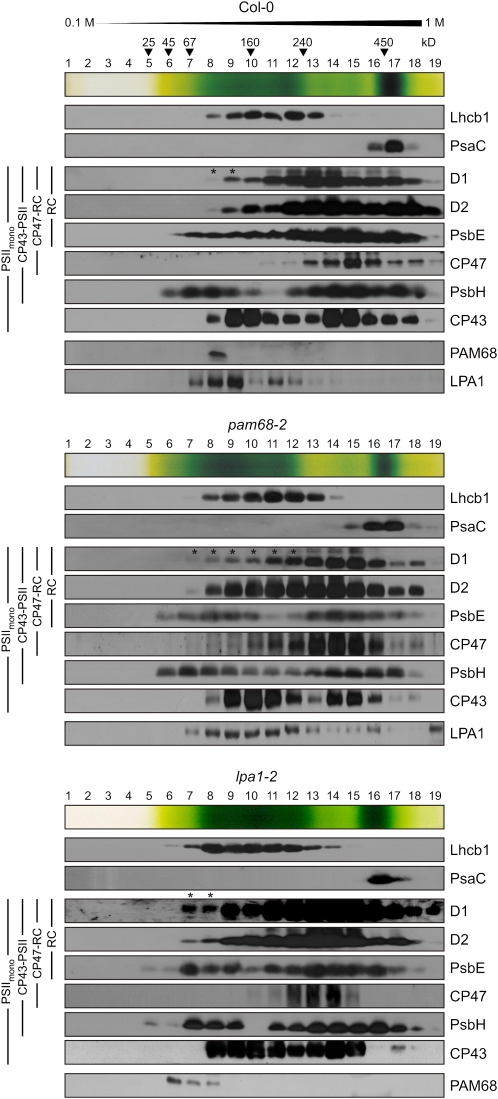
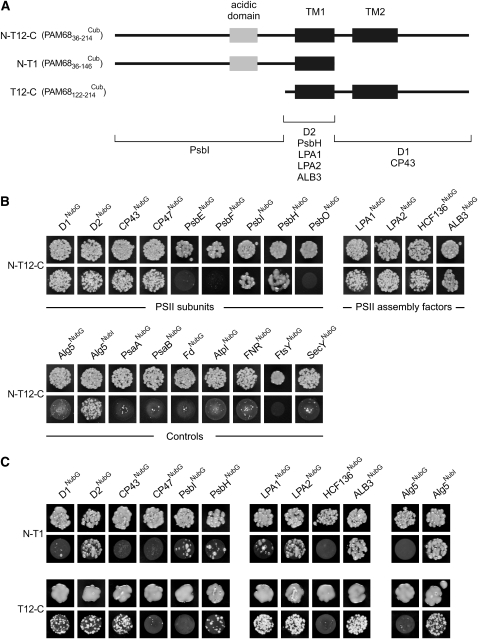
Photosystem II (PSII) is a multiprotein complex that functions as a light-driven water:plastoquinone oxidoreductase in photosynthesis. Assembly of PSII proceeds through a number of distinct intermediate states and requires auxiliary proteins. The photosynthesis affected mutant 68 (pam68) of Arabidopsis thaliana displays drastically altered chlorophyll fluorescence and abnormally low levels of the PSII core subunits D1, D2, CP43, and CP47. We show that these phenotypes result from a specific decrease in the stability and maturation of D1. This is associated with a marked increase in the synthesis of RC (the PSII reaction center-like assembly complex) at the expense of PSII dimers and supercomplexes. PAM68 is a conserved integral membrane protein found in cyanobacterial and eukaryotic thylakoids and interacts in split-ubiquitin assays with several PSII core proteins and known PSII assembly factors. Biochemical analyses of thylakoids from Arabidopsis and Synechocystis sp PCC 6803 suggest that, during PSII assembly, PAM68 proteins associate with an early intermediate complex that might contain D1 and the assembly factor LPA1. Inactivation of cyanobacterial PAM68 destabilizes RC but does not affect larger PSII assembly complexes. Our data imply that PAM68 proteins promote early steps in PSII biogenesis in cyanobacteria and plants, but their inactivation is differently compensated for in the two classes of organisms.


Figures

Figure 1.
Figure 1.
Identification and Characterization of the Mutants pam68-1 and pam68-2. (A) Five-week-old wild type (Col-0) and mutant (pam68-1 and pam68-2) plants were grown in the greenhouse (top panel), and the photosynthetic parameters F0 (minimum chlorophyll a fluorescence) and Fv/Fm (maximum quantum yield of PSII) were measured as described in Methods. Signal intensities for F0 and Fv/Fm are indicated in accordance with the color scale at the bottom of the figure. (B) Chlorophyll a fluorescence induction curves of wild-type (Col-0) and mutant (pam68-1 and pam68-2) leaves. The white bar indicates exposure to actinic light (80 μmol photons m−2 s−1) and the lightning symbols the application of saturation light pulses (0.8 s; 5000 μmol photons m−2 s−1 white light). F0 and Fm are indicated for each genotype. (C) T-DNA tagging of the PAM68/At4g19100 locus. Exons are numbered and shown as white boxes and the intron as a black line. Locations and orientations of T-DNA insertions are indicated. The pam68-1 allele was found in the GABI-KAT line GABI_152D07; pam68-2 corresponds to the SALK_044323 line from the SALK collection. Note that the T-DNAs are not drawn to scale. (D) Effect of the T-DNA insertions on steady state levels of PAM68 RNA. Aliquots (30 μg) of total leaf RNA were fractionated on a denaturing agarose gel, transferred to a positively charged nylon membrane, and hybridized with a PAM68 cDNA probe. rRNA was stained with methylene blue (M.B.) as a loading control. (E) Growth kinetics of wild type (Col-0) and mutant (pam68-1 and pam68-2) plants (n ≥ 10). Leaf area was measured during the period from 8 to 28 d after germination (d.a.g.). Bars indicate sd.
Figure 2.
Figure 2.
Immunoblot Analysis of Representative Thylakoid Proteins. (A) Total leaf proteins from pam68-2 and wild-type (Col-0) plants were fractionated by SDS-PAGE, and blots were probed with antibodies raised against individual subunits of PSII (D1, D2, CP43, CP47, PsbE, and PsbO), LHCII (Lhcb1), PSI (PsaB), the Cyt b6/f complex (Cyt f) and the chloroplast ATP synthase (β-subunit). Decreasing levels of wild-type proteins were loaded in the lanes marked 0.8x Col-0, 0.6x Col-0, 0.4 Col-0, and 0.2x Col-0. Actin served as loading control. (B) Total leaf protein extracts containing similar amounts of total D1 protein were loaded (wild type, 4 and 8 μg; pam68-2, 40 and 80 μg of protein), fractionated and treated as in (A). pD1, precursor D1; mD1, mature D1.
Figure 3.
Figure 3.
Translation Profiling of Chloroplast-Encoded Proteins. (A) Incorporation of [35S]Met into thylakoid membrane proteins of 4-week-old greenhouse-grown wild-type (Col-0) and mutant (pam68-2 and lpa1-2) plants at low light (20 μmol photons m−2 s−1). After pulse labeling of leaves with [35S]Met for 20 min in the presence of cycloheximide, thylakoid membranes were isolated, and proteins were fractionated by SDS-PAGE and detected by autoradiography. In pam68-2 and lpa1-2, incorporation of [35S]Met into D1 was reduced to 61% ± 3% and 35% ± 7% of wild-type levels, respectively, as determined by quantification of the intensity of signals shown here and of three further repetitions of the experiment. Note that Ler, the genetic background of lpa1-2, behaved like Col-0. (B) Incorporation of [35S]Met into thylakoid membrane proteins of 4-week-old wild-type (Col-0) und mutant (pam68-2) plants as in (A), except that pulses of 5, 15, and 30 min were applied. As loading control, nonlabeled LHCII was visualized by staining with Coomassie blue (C.B.B.). (C) Incorporation of [35S]Met into thylakoid membrane proteins of 4-week-old wild-type (Col-0) und mutant (pam68-2) plants grown heterotrophically (see Methods) under very low light levels (5 μmol photons m−2 s−1). Pulse labeling for 60 min and signal detection were performed as in (A). (D) SDS-solubilized membrane proteins with the equivalent of 200,000 incorporated cpm were used for immunoprecipitation with a D1-specific antibody (see Methods). As loading control, IgG heavy chains (HC) were visualized by staining with Coomassie blue. Incorporation of [35S]Met into D1 was reduced to 53% ± 4% of wild-type levels, as determined by quantification of the intensity of signals shown here and of two further repetitions of the experiment. (E) Transcript analysis in wild-type (Col-0) and mutant (pam68-2) plants. Ten-microgram aliquots of total leaf RNA from 4-week-old plants were fractionated by denaturing agarose gel electrophoresis, blotted onto nylon membrane, and hybridized with probes specific either for the first 500 bp of the coding region (psbA, psbB, psbC, and psbD) or the complete sequence (psbE) of the transcript. Note that the psbC probe recognizes both psbC (bottom bands) and psbCD (top bands) transcripts, the psbD probe detects the bicistronic psbCD transcripts (corresponding to the top two bands of the psbC probed membrane), and psbE labels psbEFJL transcripts. To control for loading, replicate blots were stained with methylene blue (M.B.) and hybridized with a probe specific for ACTIN1. (F) Association of psbA and psbD mRNAs with polysomes. Whole-cell extracts from Col-0 and pam68-2 plants were fractionated in linear 0.44 to 1.6 M (15 to 55%) sucrose gradients by ultracentrifugation. Gradients were divided into 10 fractions, and RNA was isolated from equal volumes. RNA gel blots were stained with methylene blue (M.B.) to visualize the distribution of rRNAs and then hybridized with probes specific for psbA and psbD (recognizing psbCD polycistronic transcripts). Signals were quantified (see Methods), and relative values of fractions 1 to 4, 5 to 7, and 8 to 10 calculated and given below the psbA and psbCD panels.
Figure 4.
Figure 4.
Accumulation of PSII Assembly Complexes under Steady State Conditions. (A) BN-PAGE analysis of thylakoid multiprotein complexes. Thylakoids were isolated from equal amounts of fresh leaf material (100 mg) obtained from wild-type (Col-0) and mutant (pam68-2) plants and solubilized with 1.5% (w/v) β-DM. The extracts were then fractionated by BN-PAGE. The bands detected were identified with specific protein complexes in accordance with previously published profiles (Granvogl et al., 2006; Schwenkert et al., 2006; Peng et al., 2008): PSI-NDH supercomplex (PSI-NDH; band I), PSII supercomplexes (PSIIsuper; bands II and III), PSI-LHCII complex (band IIa), PSI monomers and PSII dimers (PSImono and PSIIdi; band IV), PSII monomers and dimeric Cyt b6/f (PSIImono and Cyt b6/fdi; band V), multimeric LHCII (LHCIImult; band VI), CP43-free PSII monomers (CP43-PSII; band VII), trimeric LHCII (LHCIItri; band VIII), and monomeric LHCII (LHCIImono; band IX). PSII assembly complexes are highlighted in bold. (B) 2D BN/SDS-PAGE separation of thylakoid protein complexes. Individual lanes from BN-PA gels as in (A) were analyzed in the presence of SDS by electrophoresis on 10 to 16% PA gradient gels, which were then stained with colloidal Coomassie blue (G 250). The identity of relevant proteins is indicated by arrows. (C) Detection of PSII assembly complexes by immunoblot analyses of 2D BN/SDS gels as in (B) with antibodies against D1, D2, PsbE, PsbI, CP47, and CP43. The positions of PSII assembly complexes (PSIIsuper, PSII supercomplexes; PSIIdi, PSII dimers; PSIImono, PSII monomers; CP43-PSII, CP43-free PSII monomers; RC, reaction center-like complex) and free proteins (f.p.) are indicated. Signals were obtained by chemiluminescence. Exposure times were ~2 min (wild type) and ~10 min (mutant). Accumulation of pD1 is indicated by asterisks. (D) Signals obtained for D1, D2, PsbE, PsbI, CP43, and CP47 in (C), and for the same proteins from the lpa1-2 mutant (see Supplemental Figure 1 online), were quantified for each PSII assembly complex and for free proteins. The relative amounts of all PSII assembly complexes were calculated for each protein (summing to 1 for each protein), and mean values and standard deviations for each PSII assembly complex were determined from three replicates. Note that Ler, the genetic background of lpa1-2, behaved similar to Col-0.
Figure 5.
Figure 5.
Rates of Synthesis of PSII Assembly Complexes as Detected by Pulse-Chase Analysis. (A) and (B) 2D BN/SDS-PAGE analysis of [35S]Met incorporation into thylakoid membrane protein complexes. After pulse labeling of 4-week-old leaves with [35S]Met for 20 min in the presence of cycloheximide (A), a chase of unlabeled Met for 30 min was applied (B). After thylakoid membrane isolation, proteins were fractionated by 2D BN/SDS-PAGE and complexes visualized by autoradiography. The positions of the different PSII assembly complexes and free proteins (f.p.) are indicated as in Figure 4C. (C) Signals obtained for D1 + D2 in (A) and (B) were quantified for each PSII assembly complex as in Figure 4D. p, pulse; c, chase.
Figure 6.
Figure 6.
Sequence Alignment of Arabidopsis PAM68 and Its Homologs from Other Species. The sequence of the PAM68 protein was compared with related sequences from R. communis, Vitis vinifera, Populus trichocarpa, Zea mays, Oryza sativa, Physcomitrella patens subsp patens, C. reinhardtii, Synechocystis sp PCC 6803 and Synechococcus sp PCC 7002, and the Arabidopsis homolog At5g52780. The sequences were aligned using ClustalW and BoxShade (see Methods). Transit peptide sequences predicted by ChloroP are shown in lowercase letters. The two TM domains (TM1 and TM2) of each protein predicted by TMHMM (see Methods) are highlighted in bold; residues comprising the acidic domains are indicated by asterisks. Identical and closely related amino acids that are conserved in at least 30% of the aligned sequences are highlighted by black and gray shading, respectively.
Figure 7.
Figure 7.
2D BN/SDS-PAGE Analysis of PSII Complexes from Synechocystis Wild-Type and ins0933 Cells. Membrane samples (each equivalent to 20 μg of chlorophyll) were solubilized with β-DM, subjected to 2D BN/SDS-PAGE, and blotted onto a nitrocellulose membrane. The PSII proteins D1, pD1, CP47, CP43, and Sll0933 (the Synechocystis PAM68 homolog) were detected using appropriate antibodies. Designation of complexes: RCC1, PSII core monomers; RC47, PSII core complex lacking CP43; RCa and RCb, reaction center complexes a and b, respectively. Positions of size marker bands are indicated at the top.
Figure 8.
Figure 8.
Subcellular Localization and Topology of PAM68. (A) Suborganellar localization of PAM68. Chloroplasts, stroma, and thylakoids were isolated from oePAM68 (35S:PAM68 pam68-2) plants, fractionated by SDS-PAGE, transferred to poly(vinylidene difluoride) membrane, and visualized using antibodies raised against the acidic domain of PAM68, CSP41a (as a control for stromal proteins), or D2 (as a control for thylakoid proteins). (B) Extraction of thylakoid-associated proteins with chaotropic salt solutions or alkaline pH. Thylakoid membranes from oePAM68 plants were resuspended at 0.5 mg chlorophyll/mL in 10 mM HEPES/KOH, pH 7.5, containing either 2 M NaCl, 0.1 M Na2CO3, 2 M NaSCN, 0.1 M NaOH, or no additive. After incubation for 30 min on ice, supernatants containing the extracted proteins (s) and membrane fractions (p) were separated by SDS-PAGE and immunolabeled with antibodies raised against the acidic domain of PAM68, PsaD (as a control for peripheral membrane proteins), or Lhcb1 (as a control for integral membrane proteins). (C) Schematic representation of the two possible topologies of PAM68, with the two TMs indicated by black boxes, the acidic domain as a gray box, and the trypsin cleavage sites depicted by asterisks. In the bottom half of the panel, relevant proteolytic fragments are indicated. (D) Immunoblot analysis of thylakoid membrane preparations with antisera specific for the acidic domain of PAM68 or PsbO (as a control for luminal thylakoid proteins) before (−Trypsin) and after (+Trypsin) treatment with trypsin. In intact thylakoids, only stroma-exposed polypeptides are accessible to the enzyme.
Figure 9.
Figure 9.
Analysis of PAM68-Containing Complexes by Sucrose Gradient Sedimentation. Thylakoids (1 mg chlorophyll/mL) from wild-type (Col-0) and mutant (pam68-2 and lpa1-2) plants were solubilized with 1% (w/v) β-DM and separated by centrifugation in a linear 0.1 to 1 M sucrose gradient. Note that because chlorophyll (a + b) levels in pam68-2 plants are equivalent to 65% of wild-type chlorophyll levels, the pam68-2 sample contained ~50% more protein. Nineteen fractions were collected (numbered from top to bottom) from two wild-type and four pam68-2 and lpa1-2 gradients, and fractions from the same genotype were pooled. Proteins were precipitated from each fraction, separated by SDS-PAGE, blotted onto poly(vinylidene difluoride) membranes, and detected with antibodies against D1, D2, PsbE, CP47, PsbH, CP43, PAM68, and LPA1, as well as PsaC and Lhcb1. At the top of each blot, an image of the sucrose gradient is shown, and the positions of molecular mass markers in the gradient are indicated. Note that Ler, which serves as wild-type control for lpa1-2, behaved very similarly to Col-0 (see Supplemental Figure 7 online) and that PAM68 and LPA1 were not detected in pam68-2 and lpa1-2 samples, respectively. Accumulation of pD1 is indicated by asterisks.
Figure 10.
Figure 10.
Interaction of PAM68 with Other Thylakoid Proteins. (A) Schematic presentation of the fragments of PAM68 used to identify interaction domains. The acidic domain is shown as a gray box and the two TMs as black boxes. In the bottom half of the panel, the three interaction domains and the corresponding interacting proteins are shown. (B) Split-ubiquitin assays for interactions between full-length PAM68 and selected thylakoid proteins. Assays were performed employing fusions to the C- (Cub) and N- (NubG) terminal halves of ubiquitin. Alg5NubI (the unrelated endoplasmic reticulum membrane protein Alg5 fused to the wild-type Nub) served as a positive control. Alg5 fused to NubG (Alg5NubG) was used as the negative control. To test for interactions involving the PAM68 protein, the mature PAM68 protein was fused to Cub (N-T12-C or PAM6836-214Cub), and the selected thylakoid proteins were fused to NubG. Yeast colonies were first plated on permissive (-LT, top panels) and then on selective medium (-LTH, bottom panels) (see Methods). (C) Interaction mapping to distinct domains of PAM68. Two different fragments as shown in (A) were employed to detect interactions between domains of PAM68 and selected thylakoid proteins. Split-ubiquitin assays were performed as in (B).

References

    1. Adir N., Zer H., Shochat S., Ohad I. (2003). Photoinhibition - A historical perspective. Photosynth. Res. 76: 343–370 - PubMed
    1. Alonso J.M., et al. (2003). Genome-wide insertional mutagenesis of Arabidopsis thaliana. Science 301: 653–657 - PubMed
    1. Anbudurai P.R., Mor T.S., Ohad I., Shestakov S.V., Pakrasi H.B. (1994). The ctpA gene encodes the C-terminal processing protease for the D1 protein of the photosystem II reaction center complex. Proc. Natl. Acad. Sci. USA 91: 8082–8086 - PMC - PubMed
    1. Aro E.M., Suorsa M., Rokka A., Allahverdiyeva Y., Paakkarinen V., Saleem A., Battchikova N., Rintamäki E. (2005). Dynamics of photosystem II: A proteomic approach to thylakoid protein complexes. J. Exp. Bot. 56: 347–356 - PubMed
    1. Aronsson H., Jarvis P. (2002). A simple method for isolating import-competent Arabidopsis chloroplasts. FEBS Lett. 529: 215–220 - PubMed

MeSH terms

Substances