. 2010 Oct 5:6:417.
doi: 10.1038/msb.2010.71.

Dynamic interaction networks in a hierarchically organized tissue

Affiliations

Dynamic interaction networks in a hierarchically organized tissue

Daniel C Kirouac et al. Mol Syst Biol. .

Abstract

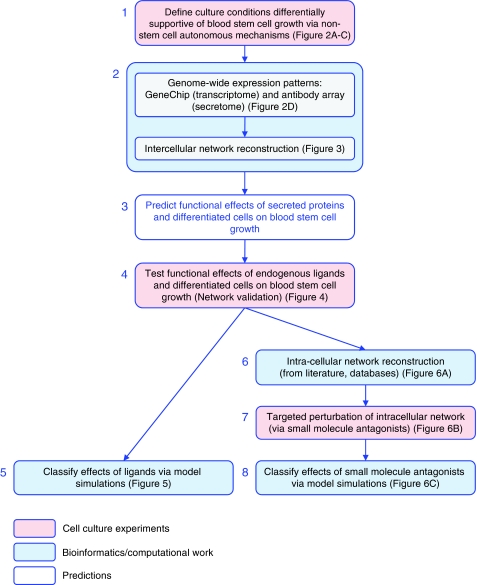
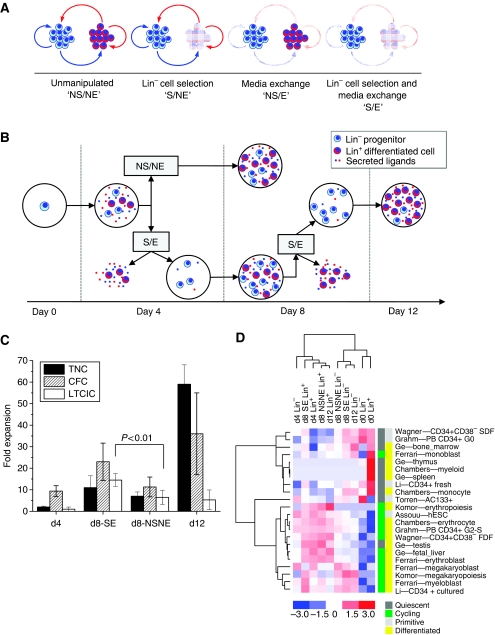
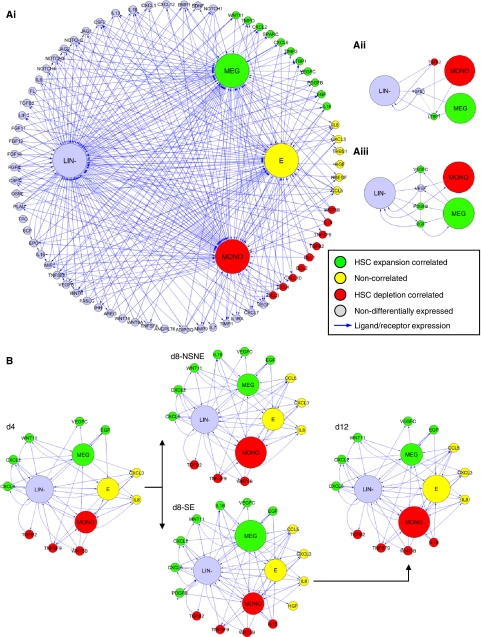
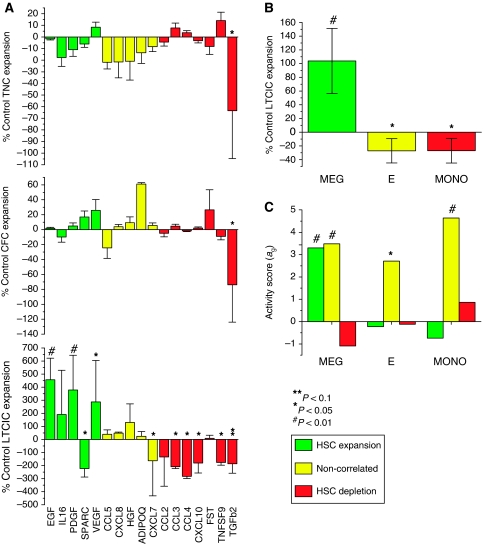
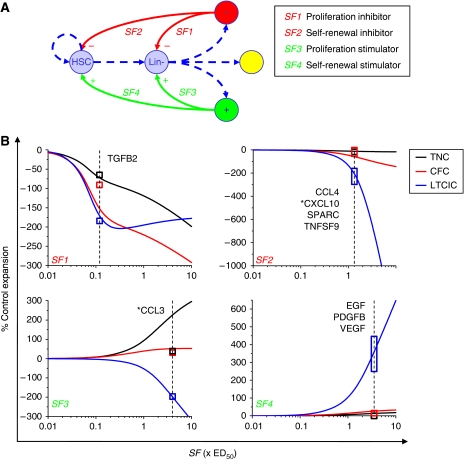
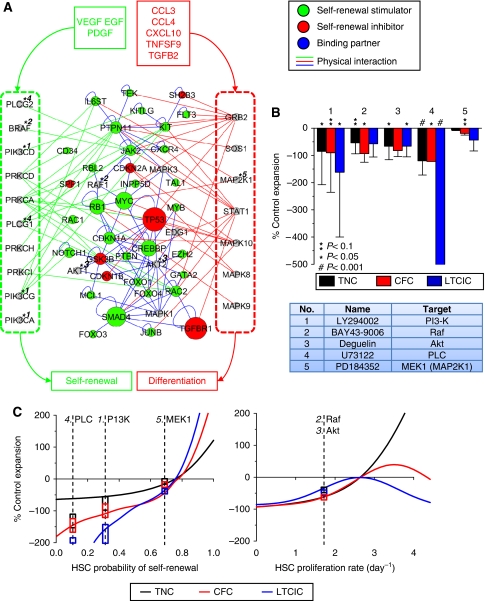
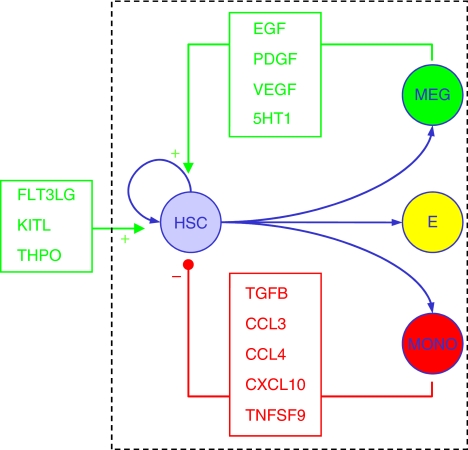
Intercellular (between cell) communication networks maintain homeostasis and coordinate regenerative and developmental cues in multicellular organisms. Despite the importance of intercellular networks in stem cell biology, their rules, structure and molecular components are poorly understood. Herein, we describe the structure and dynamics of intercellular and intracellular networks in a stem cell derived, hierarchically organized tissue using experimental and theoretical analyses of cultured human umbilical cord blood progenitors. By integrating high-throughput molecular profiling, database and literature mining, mechanistic modeling, and cell culture experiments, we show that secreted factor-mediated intercellular communication networks regulate blood stem cell fate decisions. In particular, self-renewal is modulated by a coupled positive-negative intercellular feedback circuit composed of megakaryocyte-derived stimulatory growth factors (VEGF, PDGF, EGF, and serotonin) versus monocyte-derived inhibitory factors (CCL3, CCL4, CXCL10, TGFB2, and TNFSF9). We reconstruct a stem cell intracellular network, and identify PI3K, Raf, Akt, and PLC as functionally distinct signal integration nodes, linking extracellular, and intracellular signaling. This represents the first systematic characterization of how stem cell fate decisions are regulated non-autonomously through lineage-specific interactions with differentiated progeny.


Conflict of interest statement

The authors declare that they have no conflict of interest.

Figures

Figure 1
Figure 1
Experimental and computational workflow. Boxes represent independent research steps, successively numbered and color-coded according to experimental (pink) versus computational (blue) work. After defining culture manipulations capable of differentially modulating stem cell growth via non-cell autonomous effects, molecular profiling experiments were conducted to systematically explore the underlying molecular and cellular dynamics. Intercellular signaling networks were then reconstructed using gene expression data. Endogenous ligands and differentiated cell populations comprising the intercellular networks were tested for functional effects on blood stem cell growth in culture. An intracellular network associated with blood stem cell self-renewal was then constructed using molecular databases, as a platform to identify core proteins onto which signaling pathways activated by the various functional ligands converge. Small molecule antagonists were then used to perturb these intracellular targets, and a mechanistic model of blood cell development used to classify the effects of the extracellular and intracellular manipulations on cell population-specific kinetic parameters (self-renewal and proliferation).
Figure 2
Figure 2
Functional and molecular profiling of hematopoietic progenitor (Lin) and differentiated (Lin+) cells propagated in liquid culture. (A) Schematic representation of autocrine and paracrine signaling between Lin progenitor (blue) and Lin+ differentiated (red) cells. These signals can be disrupted in vitro by depleting Lin+ cells (cell selection (S) versus no selection (NS)), and/or depleting secreted ligands (conditioned media exchange (E) versus no exchange (NE)). (B) Cell culture methodology. Umbilical cord blood derived-Lin cells were cultured in serum-free cytokine-supplemented media for 8 days unmanipulated (no selection and no exchange; ‘NSNE’), or for 12 days in total with Lin cell selection and media exchanges (‘SE’) performed every 4 days. (C) Total (TNC), progenitor (CFC), and primitive progenitor (LTCIC) cell expansion as a function of culture condition. Error bars represent s.d, n=3–5. (D) Cell population dynamics and sample relationships inferred from differential gene expression patterns; activity scores for published characteristic gene sets (indicated by first author—cell type) are depicted as a hierarchical clustered heat map with associated dendograms. Only gene sets with activity scores⩾2 in at least one sample, and CV⩾20% across samples are included (21 in total). For visualization, activity scores are mean-centered across samples and scaled to ±3 s.d. Gene sets are characterized by color coding as quiescent versus cycling (dark gray versus green), and primitive versus differentiated (light gray versus yellow) cell types.
Figure 3
Figure 3
Reconstructed intercellular signaling networks. Signaling between culture-derived Lin- progenitors (LIN-) and differentiated megarkaryocytes (MEG), erythrocytes (E), and monocytes (MONO) mediated via secreted proteins. Cells and ligands are color coded according to differential expression patterns, corresponding to predicted stimulators (green), inhibitors (red), and non-function effectors of stem cell growth. (Ai) Total network, consisting of four cells populations and 77 secreted proteins. (Aii) TGF-β subnetwork. (Aiii) VEGF/EGF/PDGF subnetwork. Functional interactions between secreted proteins are indicated via gray connections in the two subnetworks; LTBP1 inhibits TGF-β ligands from activating the corresponding receptors (Aii), and PDGF is known to display intracellular synergism with both EGF and VEGF signaling (Aiii). (B) Dynamic representation of network; only differentially expressed ligands (at the transcriptional level) are included, and cell populations are size coded according to relative compositional changes inferred from gene expression data.
Figure 4
Figure 4
Functional validation of cell population and secreted protein effects on progenitor expansion in vitro. (A) Eight day expansions of total cells (TNC), progenitors (CFC), and primitive progenitors (LTCIC) for cultures supplemented with stem cell expansion (green), depletion (red), and non-correlated (yellow) ligands in comparison to control cultures. Error bars=s.d., n=4–8. (B) Seven day LTCIC expansion from an enriched primitive cell population (LinRholoCD34+CD38) cocultured with in vitro-generated megakaryocytes (MEG; CD41+), erythrocytes (E; CD235a+), and monocytes (MONO; CD14+) in comparison to control cultures. Error bars=95% CI, n=3. (C) Activity scores for secreted protein gene sets correlated with stem cell expansion (green), depletion (red), and non-correlated (yellow), for megakaryocyte (MEG), erythrocyte (E), and monocyte (MONO) cell population expression profiles from Ferrari et al (2007).
Figure 5
Figure 5
Simulated activities of theoretical proliferation and self-renewal regulatory factors functionally classify experimentally identified ligands. (A) Schematic diagram representing theoretical interactions between endogenous secreted factors and cellular kinetic parameters. Self-renewal and the proliferation rates of stem cells and progenitors are regulated by the balance of endogenous inhibitory (SF2, SF1) and stimulatory (SF4, SF3) secreted regulatory factors. The LTCIC and CFC populations lie at successive stages downstream of the HSC within the Lin population, whereas the TNC readout encompasses all cells (B) Simulated dose–response relationships between theoretical ligand concentrations (expressed as ED50 values) and 8-day fold total cell (TNC), progenitor (CFC), and primitive progenitor (LTCIC) expansions, normalized to control culture output. Experimental data from Figure 4 are overlaid for visual depiction of the model-based functional classifications of the ligands. Boxes indicate ±1 s.d., overlaid at estimated ligand ED50 concentrations. Asterisks indicate marginally optimal ligand classifications.
Figure 6
Figure 6
Integration of endogenous regulatory signals in the HSC intracellular self-renewal network. (A) Endogenous secreted stimulators (VEGF, EGF, PDGF, and 5HT1) and inhibitors (CCL3, CCL4, CXCL10, TNFSF9, and TGFB2) activate cell surface receptors on HSCs, inducing signal transduction events, which are coherently processed by the intracellular network to modulate rates of self-renewal versus differentiation. Common signal transduction molecules shared by stimulatory pathways (left; green box), inhibitory pathways (right; red box), and both (center) are densely connected to known self-renewal effector genes. Physical protein–protein interactions from stimulatory and inhibitory pathways are represented as green and red edges, respectively, whereas internal interactions are represented as blue edges. (B) Five small molecule antagonists, described in the table with targets indicated by numbers on the network, were tested for functional effects on 8-day fold expansions of total cells (TNC), progenitors (CFC), and primitive progenitors (LTCIC) with respect to control cultures. (C) To classify the functional activities of the molecules, culture simulations were run over a feasible range of HSC self-renewal probabilities and proliferation rates. On the basis of ΔWRSS ranking of effects on TNC, CFC, and LTCIC output, inhibition of PI3K and Raf, reduces self-renewal, whereas inhibition of Akt reduces proliferation. Experimental data is overlaid for visual depiction of the model-based functional classifications of the kinase inhibitors. Boxes indicate ±1 s.d., overlaid at estimated effects levels.
Figure 7
Figure 7
Schematic summary of experimental findings. In addition to exogenous growth factors (FLT3LG, KITL, and THPO in our cultures), stem cell output is regulated by secreted factor-mediated cell–cell interactions. An antagonistic axis of intercellular communication is established, wherein culture-derived monocytes secrete high levels of factors (CCL3, CCL4, CXCL10, TGFB2, and TNSFS9), which inhibit stem cell self-renewal, whereas culture-derived megakaryocytes secrete high levels of factors (EGF, PDGFB, VEGF, and serotonin (5HT1)), which stimulate stem cell self-renewal, functioning as a coupled positive and negative intercellular feedback circuit.

References

    1. Bamborough P, Drewry D, Harper G, Smith GK, Schneider K (2008) Assessment of chemical coverage of kinome space and its implications for kinase drug discovery. J Med Chem 51: 7898–7914 - PubMed
    1. Brown KR, Jurisica I (2005) Online predicted human interaction database. Bioinformatics 21: 2076–2082 - PubMed
    1. Broxmeyer HE, Kim CH (1999) Regulation of hematopoiesis in a sea of chemokine family members with a plethora of redundant activities. Exp Hematol 27: 1113–1123 - PubMed
    1. Bryder D, Ramsfjell V, Dybedal I, Theilgaard-Monch K, Hogerkorp CM, Adolfsson J, Borge OJ, Jacobsen SE (2001) Self-renewal of multipotent long-term repopulating hematopoietic stem cells is negatively regulated by Fas and tumor necrosis factor receptor activation. J Exp Med 194: 941–952 - PMC - PubMed
    1. Cashman JD, Eaves AC, Raines EW, Ross R, Eaves CJ (1990) Mechanisms that regulate the cell cycle status of very primitive hematopoietic cells in long-term human marrow cultures. I. Stimulatory role of a variety of mesenchymal cell activators and inhibitory role of TGF-beta. Blood 75: 96–101 - PubMed

Publication types

Substances