. 2010 Oct 26;103(9):1400-6.
doi: 10.1038/sj.bjc.6605945. Epub 2010 Oct 5.

Detecting treatment response in a model of human breast adenocarcinoma using hyperpolarised [1-13C]pyruvate and [1,4-13C2]fumarate

Affiliations

Detecting treatment response in a model of human breast adenocarcinoma using hyperpolarised [1-13C]pyruvate and [1,4-13C2]fumarate

T H Witney et al. Br J Cancer. .

Abstract

Background: The recent introduction of a dynamic nuclear polarisation technique has permitted noninvasive imaging of tumour cell metabolism in vivo following intravenous administration of (13)C-labelled cell substrates.

Methods: Changes in hyperpolarised [1-(13)C]pyruvate and [1,4-(13)C(2)]fumarate metabolism were evaluated in both MDA-MB-231 cells and in implanted MDA-MB-231 tumours following doxorubicin treatment.

Results: Treatment of MDA-MB-231 cells resulted in the induction of apoptosis, which was accompanied by a decrease in hyperpolarised (13)C label flux between [1-(13)C]pyruvate and lactate, which was correlated with a decrease in the cellular NAD(H) coenzyme pool. There was also an increase in the rate of fumarate conversion to malate, which accompanied the onset of cellular necrosis. In vivo, the decrease in (13)C label exchange between pyruvate and lactate and the increased flux between fumarate and malate, following drug treatment, were shown to occur in the absence of any detectable change in tumour size.

Conclusion: We show here that the early responses of a human breast adenocarcinoma tumour model to drug treatment can be followed by administration of both hyperpolarised [1-(13)C]pyruvate and [1,4-(13)C(2)]fumarate. These techniques could be used, therefore, in the clinic to detect the early responses of breast tumours to treatment.


Figures
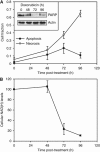
Figure 1
Figure 1
Cell death and NADH depletion in MDA-MB-231 cells following doxorubicin treatment. (A) Cell fraction undergoing apoptosis (▪) and necrosis (○), as determined by flow cytometry. Apoptotic cells were detected using annexin V Pacific Blue (λ Ex/Em=410/455) and necrotic cells using SYTOX Red nuclear staining (λ Ex/Em=640/658). Inset: Representative western blot of PARP expression in MDA-MB-231 cells following doxorubicin treatment. Actin was used as a loading control. (B) Changes in the cellular NADH pool following treatment. The NADH pool was measured by recording changes in UV autofluorescence, as detected by flow cytometry (λ Ex/Em=350/455).
Figure 2
Figure 2
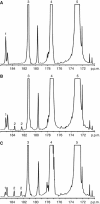
Representative 13C spectra of cell suspensions 15 s after the addition of 75 mM hyperpolarised [1-13C]pyruvate, 20 mM hyperpolarised [1,4-13C2]fumarate and 75 mM unlabelled lactate. Cells were either untreated (A), or had been treated with doxorubicin for 72 h (B) or 96 h (C). The labelled peaks are: 1, [1-13C]lactate; 2, [1,4-13C2]malate; 3, [1-13C]pyruvate hydrate; 4, [1,4-13C2]fumarate; 5, [1-13C]pyruvate.
Figure 3
Figure 3
Effect of doxorubicin-induced cell death on flux of hyperpolarised 13C label between pyruvate and lactate, and between fumarate and malate in an MDA-MB-231 cell suspension. (A) [1-13C]lactate peak intensities after addition of 75 mM hyperpolarised [1-13C]pyruvate, 20 mM hyperpolarised [1,4-13C2]fumarate and 75 mM unlabelled lactate to MDA-MB-231 cell suspensions that had been treated with doxorubicin or were untreated. Spectra were corrected for cell number and scaled to the initial pyruvate signal intensity to correct for variation in polarisation levels. Shaded regions represent 1 s.e.m. (n=4 for all treatment groups). (B) Changes in [1-13C]pyruvate–[1-13C]lactate exchange rate constant following doxorubicin treatment. The exchange rate constant (kP) was derived by fitting changes in signal peak intensity to the modified Bloch equations for two-site exchange. Mean values (n=4) and s.d. are shown (*P<0.05, **P<0.01). (C) Total [1,4-13C2]malate peak intensities after addition of 75 mM hyperpolarised [1-13C]pyruvate, 20 mM hyperpolarised [1,4-13C2]fumarate and 75 mM unlabelled lactate to MDA-MB-231 cell suspensions that had been treated with doxorubicin or were untreated. Spectra were corrected for cell number and scaled to the initial fumarate signal intensity to correct for variation in polarisation levels. Shaded regions represent 1 s.e.m. (n=4 for all treatment groups). (D) Changes in the rate constant describing hyperpolarised 13C label flux between [1,4-13C2]fumarate and [1,4-13C2]malate following doxorubicin treatment. The rate constant (kF) was derived by fitting changes in signal peak intensities to the modified Bloch equations for two-site exchange. Mean values (n=4) and s.d. are shown (*P<0.05, **P<0.01).
Figure 4
Figure 4
Correlation between cellular necrosis and the rate constant describing hyperpolarised 13C label flux between [1,4-13C2]fumarate and malate. Necrosis was monitored by flow cytometric analysis of SYTOX Red dead cell staining (λ Ex/Em=640/658). In separate experiments, the rate constant (kF) was derived by fitting changes in signal peak intensities to the modified Bloch equations for two-site exchange. Mean values (n=3–4) and s.d. are shown.
Figure 5
Figure 5
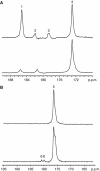
Detection of treatment response in implanted MDA-MB-231 tumours. Representative 13C spectra from untreated (upper spectra) or doxorubicin-treated (lower spectra) tumours 20 s post-injection of either hyperpolarised [1-13C]pyruvate (A), or hyperpolarised [1,4-13C2]fumarate (B). The peaks are: 1, [1-13C]lactate; 2, [1-13C]pyruvate hydrate; 3, [1-13C]alanine; 4, [1-13C]pyruvate; 5, [1,4-13C2]fumarate; 6, [1,4-13C2]malate. Spectra were taken 48 and 24 h post-doxorubicin treatment for the pyruvate and fumarate experiments, respectively.

References

    1. Aboagye EO, Bhujwalla ZM (1999) Malignant transformation alters membrane choline phospholipid metabolism of human mammary epithelial cells. Cancer Res 59(1): 80–84 - PubMed
    1. Ardenkjaer-Larsen JH, Fridlund B, Gram A, Hansson G, Hansson L, Lerche MH, Servin R, Thaning M, Golman K (2003) Increase in signal-to-noise ratio of >10 000 times in liquid-state NMR. Proc Natl Acad Sci USA 100(18): 10158–10163 - PMC - PubMed
    1. Aubin JE (1979) Autofluorescence of viable cultured mammalian cells. J Histochem Cytochem 27(1): 36–43 - PubMed
    1. Biersack HJ, Bender H, Palmedo H (2004) FDG-PET in monitoring therapy of breast cancer. Eur J Nucl Med Mol Imaging 31(Suppl 1): S112–S117 - PubMed
    1. Brindle K (2008a) New approaches for imaging tumour responses to treatment. Nat Rev Cancer 8(2): 94–107 - PubMed

Publication types