. 2011 Apr;68(8):1415-28.
doi: 10.1007/s00018-010-0528-y. Epub 2010 Sep 19.

MicroRNA-128 downregulates Bax and induces apoptosis in human embryonic kidney cells

Affiliations

MicroRNA-128 downregulates Bax and induces apoptosis in human embryonic kidney cells

Yogita K Adlakha et al. Cell Mol Life Sci. 2011 Apr.

Abstract

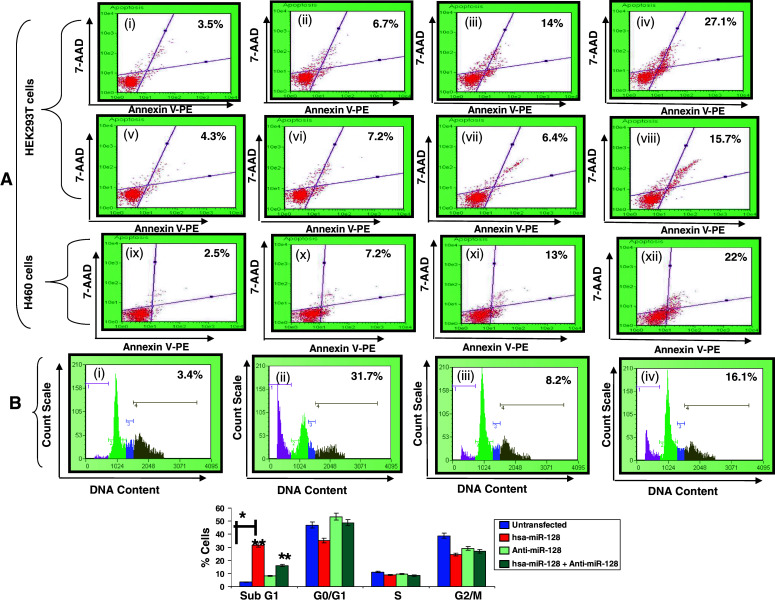
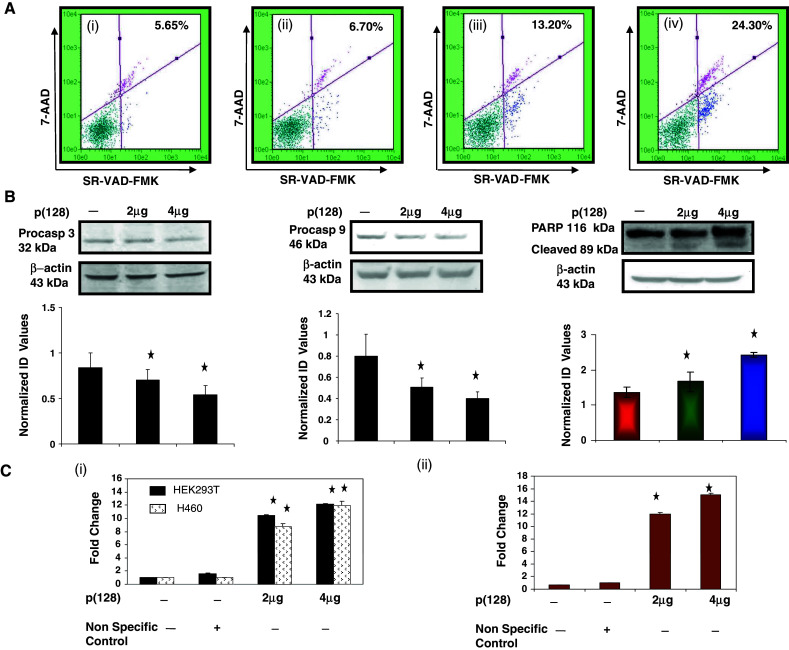
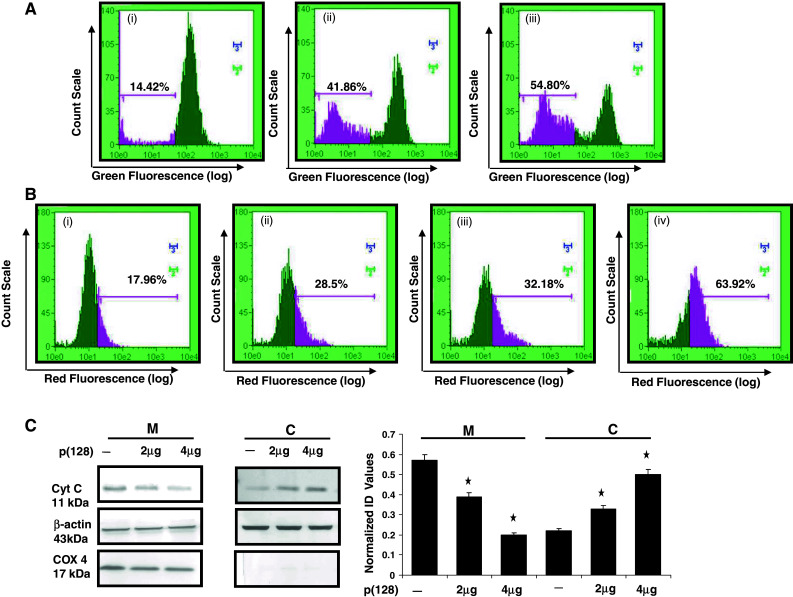
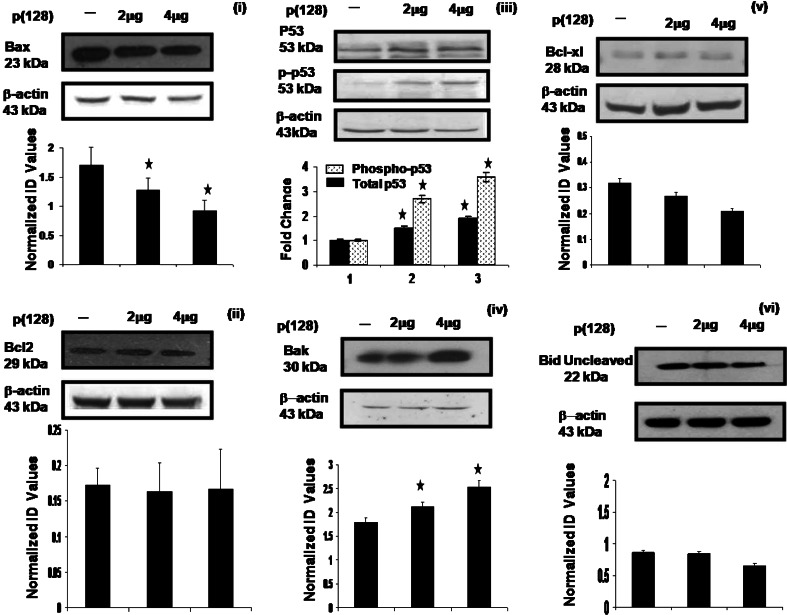
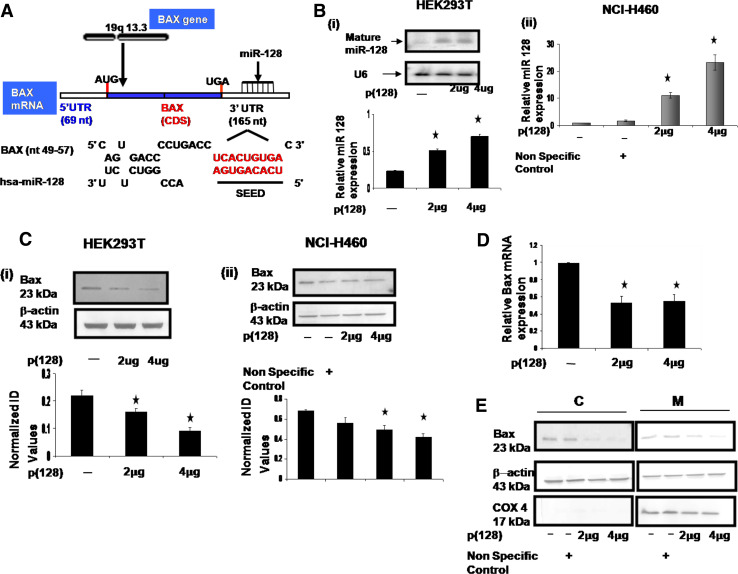
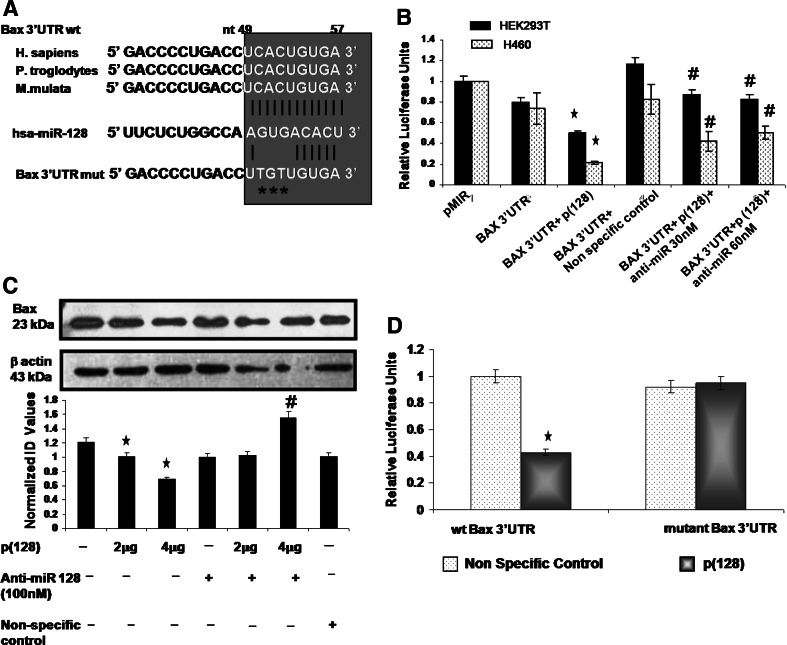
MicroRNAs (miRNAs) are short ~21-nt non-coding RNA molecules that have been shown to regulate a number of biological processes. Previous reports have shown that overexpression of miR-128 in glioma cells inhibited cell proliferation. Literature also suggests that miR-128 negatively regulates prostate cancer cell invasion. Here, we show that overexpression of hsa-miR-128, a brain-enriched microRNA, induces apoptosis in HEK293T cells as elucidated by apoptosis assay, cell cycle changes, loss of mitochondrial membrane potential and multicaspase assay. By in silico analysis, we identified a putative target site within the 3' untranslated region (UTR) of Bax, a proapoptotic member of the apoptosis pathway. We found that ectopic expression of hsa-miR-128 suppressed a luciferase reporter containing the Bax-3' UTR and reduced the levels of Bax in HEK293T cells. Taken together, our study demonstrates that overexpression of hsa-miR-128 not only induces apoptosis in HEK293T cells but also is an endogenous regulator of Bax protein.


Figures

Fig. 1
Fig. 1
hsa-miR-128 induces apoptosis in HEK293T and NCI-H460 cells. a Annexin V-staining in HEK293T and NCI-H460 cells. Upper panel (i)–(viii) are HEK293T cells: (i) untransfected, (ii) non-specific control, (iii) 2 μg p(128), (iv) 4 μg p(128), (v) anti-miR 200 nM, (vi) 2 μg p(128) + anti-miR 200 nM, (vii) anti-miR 400 nM, (viii) 4 μg p(128) + anti-miR 400 nM, and lower panel, (ix)–(xii) is NCI-H460 cells: (ix) untransfected, (x) non-specific control, (xi) 2 μg p(128), (xii) 4 μg p(128). After 24 h of transfection, annexin V assay was done as described in “Materials and methods”. X-axis represents Annexin V-PE positive cells whereas Y-axis represents 7-AAD positive cells. % here indicates the percentage of dead cells. Representative of three independent experiments has been shown with similar results (p < 0.05) b Cell cycle distribution of HEK293T cells. (i) Untransfected, (ii) transfected with 4 μg p(128), (iii) transfected with anti-miR 100 nM, (iv) transfected with 4 μg p(128) + anti-miR 100 nM. Cells were harvested after 24 h of transfection and subsequently assayed for their DNA content by flow cytometry. X-axis represents DNA content whereas Y-axis represents count scale. Top panel shows the representative of three independent experiments with similar results and the bottom panel represents the bar diagram of cells in different phases of cell cycle. Bar graph represents mean ± SEM from three independent experiments. *p < 0.05 versus control, **p < 0.001, (*) p < 0.05 versus untransfected, (**)p < 0.001 versus hsa-miR-128
Fig. 2
Fig. 2
Involvement of Caspase activation in hsa-miR-128 induced apoptosis in HEK293T cells. a Multicaspase assay was done using SR-VAD-FMK inhibitor of caspases as described in “Materials and methods”. (i) Untransfected, (ii) non-specific control, (iii) transfected with 2 μg p(128), (iv) transfected with 4 μg p(128). X-axis represents SR-VAD-FMK positive cells whereas Y-axis represents 7-AAD positive cells. Results shows the representative of three independent experiments with similar results (p < 0.05) b Western blot analysis of the expression of the Pro-caspase-3, Pro-caspase-9 and PARP protein performed on total cell extracts from untransfected HEK293T cells and HEK293T cells transfected with 2 or 4 μg p(128). β-actin was used as a loading control. The protein band was quantified and normalized to β-actin intensities. Bar graph represent the mean ± SEM, p < 0.05. Normalized ID values represent normalized integrated densitometric values. c Caspase 3 (i), and 9 (ii) activity was checked in untransfected and transfected HEK293T cells with either non-specific control or 2 or 4 μg p(128). The assay was done as described in “Materials and methods” by determining the extent of cleavage of caspases substrates: N-acetyl-Asp-Glu-Val-Aspp-nitroanilide (Ac-DEVD-pNA), N-acetyl-Leu-Glu-His-Asp-p-nitroanilide (Ac-LEHD-pNA), respectively. Caspase-3 activity assay was also done in NCI-H460 cells. Data are the mean ± SEM of the fold increase above untransfected absorbance values of three independent experiments performed in duplicate. Statistical significance: p < 0.05
Fig. 3
Fig. 3
Disruption of mitochondrial membrane potential, ROS generation and release of cytochrome c in cytosol in HEK293T cells by hsa-miR-128. a ∆ψm was estimated using DiOC6. (i) Untransfected, (ii) transfected with 2 μg p(128), (iii) transfected with 4 μg p(128) for 24 h. 30 min prior to harvesting, cells were incubated with 40 nM DiOC6. After incubation, cells were harvested, and change in fluorescence was measured using flow cytometry p < 0.05 b ROS generation was checked by DHE. (i) untransfected, (ii) transfected with 2 μg p(128), (iii) transfected with 4 μg p(128) for 24 h (iv) H2O2 was used as a positive control. The illustrated histograms are representative of three independent experiments p < 0.05 with similar results. c Release of Cytochrome c from mitochondria to cytoplasm after the overexpression of miR-128. Mitochondrial and cytoplasmic fractions were separated as described in the “Materials and methods” section. C represents Cytoplasmic fraction and M represents Mitochondrial fraction. The purity of the fractions was determined by the expression of Cox 4 (mitochondrial specific protein). β-actin was used as a loading control. The protein band was quantified and normalized to β-actin intensities. Bar mean ± SEM, *p < 0.05, n = 3. Normalized ID values represent normalized integrated densitometric values
Fig. 4
Fig. 4
Effect of hsa-miR-128 on the apoptotic pathway proteins in HEK293T cells. Western blot analysis of Bax, p53, p-p53, Bcl-2, Bcl-xL, Bak and Bid performed on total cell extracts from untransfected HEK293T cells and HEK293T cells transfected with 2 or 4 μg p(128). β-actin was used a loading control. Data are representative of a typical experiment repeated three times with similar results. The protein band was quantified and normalized to β-actin. Bar graph represents the mean ± SEM, *p < 0.05 versus control. Normalized ID values represent normalized integrated densitometric values
Fig. 5
Fig. 5
Bax is the predicted target of hsa-miR-128. a Schematic representation of Bax and its 3′UTR indicating the binding site of hsa-miR-128 as predicted. First nine nucleotides of miR-128 and its target region (Bax 3′UTR): red colored, bold shows complete complementarity. b (i) Northern blot analysis of total RNA extracted from untransfected HEK293T cells and HEK293T cells transfected with 2 or 4 μg p(128). Hybridization to the U6 small nuclear RNA is shown as a loading control. Graph shows relative hsa-miR-128 expression. *p < 0.05 versus control, (ii) Taqman assay for mature miR-128 in NCI-H460 cells showing overexpression of miR-128 in cells transfected with 2 or 4 μg p(128). c Western blot of Bax performed on total cell extracts (i) from untransfected HEK293T cells and HEK293T cells transfected with 2 or 4 μg p(128) (left panel), and (ii) NCI-H460 cells (right panel). β-actin was used a loading control. The protein band was quantified and normalized to β-actin. Graph is plotted as mean of three independent experiments. Error bars ± SEM, *p < 0.05 versus control. Normalized ID values represent normalized integrated densitometric values. d Real-time RT–PCR analysis of Bax expression in untransfected HEK293T and HEK293T cells transfected with 2 or 4 μg p(128). Data are expressed as the average ± SEM of three independent experiments performed in triplicate. *p < 0.05 versus control. e Subcellular fractionation of Bax protein in untransfected HEK293T and HEK293T cells transfected with either non-specific control or 2 or 4 μg p(128). Cytosolic and mitochondria extracts were prepared as described in “Materials and methods”. C Cytoplasmic fraction, M mitochondrial fraction. The purity of the fractions was determined by the expression of Cox 4 (mitochondrial specific protein). β-actin was used as a loading control. Blot is a typical representative of three experiment with similar results
Fig. 6
Fig. 6
hsa-miR-128 negatively regulates the Bax expression in HEK293T cells. a Comparison of binding site of miR-128 in Bax 3′UTR in three different species. Target site of miR-128 in the 3′UTR of Bax is completely conserved in H. sapiens (Human), P. troglodytes (Chimpanzee) and M. mulata (Rhesus). The miR-128 binding site has been mutated in Bax 3′UTR as shown by asterisks. b Luciferase assay in HEK293T and NCI-H460 cells. Cells were cotransfected with pMIR-REPORT-Bax 3′UTR (wild type) with either p(128) or non-specific control or in combination with p(128) + anti-miR-128 at 30 or 60 nM. Luminescence was measured at 24 h post transfection. The luciferase activity relative to pMIR-REPORT (intact) was plotted. The bar diagram represents mean ± SEM for three independent experiments. *p < 0.05 versus pMiR (Parental luciferase construct). #p < 0.02 versus Bax 3′UTR + p(128). c Upper panel shows western blot analysis for Bax after transfection of clone expressing miR-128 (p(128)) in a dose-dependent manner, either alone or with anti-miR-128 at 100 nM. Non-specific control was also used wherever indicated in figure. The same blot was probed for β-actin for normalization. Data are representative of a typical experiment repeated three times with similar results. Lower panel shows the bar diagram represents mean ± SEM for three independent experiments. *p < 0.05 versus untransfected. #p < 0.02 versus 4 μg p(128). d The reporter constructs including wild type or mutant Bax 3′UTR was cotransfected with either miR-128 or non-specific control. Relative firefly luciferase activities were normalized with the Renilla luciferase activities. The luciferase activity relative to non-specific control was plotted. The bar diagram represents mean ± SEM for three independent experiments. *p < 0.05 versus control

References

    1. Pillai RS. MicroRNA function: multiple mechanisms for a tiny RNA? RNA. 2005;11:1753–1761. doi: 10.1261/rna.2248605. - DOI - PMC - PubMed
    1. Zamore PD, Haley B. Ribo-gnome: the big world of small RNAs. Science. 2005;309:1519–1524. doi: 10.1126/science.1111444. - DOI - PubMed
    1. Yu Z, Jian Z, Shen SH, Purisima E, Wang E. Global analysis of microRNA target gene expression reveals that miRNA targets are lower expressed in mature mouse and Drosophila tissues than in the embryos. Nucleic Acids Res. 2007;35:152–164. doi: 10.1093/nar/gkl1032. - DOI - PMC - PubMed
    1. Karp X, Ambros V. Developmental biology. Encountering microRNAs in cell fate signaling. Science. 2005;310:1288–1289. doi: 10.1126/science.1121566. - DOI - PubMed
    1. Chen CZ, Li L, Lodish HF, Bartel DP. MicroRNAs modulate hematopoietic lineage differentiation. Science. 2004;303:83–86. doi: 10.1126/science.1091903. - DOI - PubMed

Publication types