. 2010 Oct 28;114(42):13574-84.
doi: 10.1021/jp106981c.

Partitioning and localization of environment-sensitive 2-(2'-pyridyl)- and 2-(2'-pyrimidyl)-indoles in lipid membranes: a joint refinement using fluorescence measurements and molecular dynamics simulations

Affiliations

Partitioning and localization of environment-sensitive 2-(2'-pyridyl)- and 2-(2'-pyrimidyl)-indoles in lipid membranes: a joint refinement using fluorescence measurements and molecular dynamics simulations

Alexander Kyrychenko et al. J Phys Chem B. .

Abstract

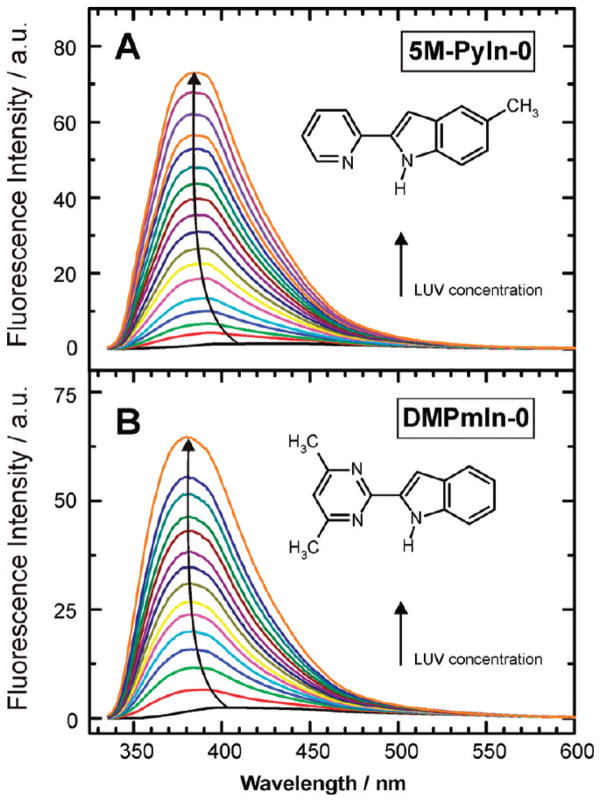
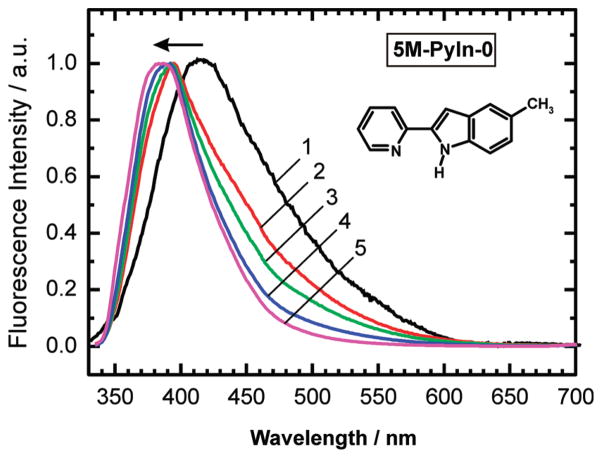
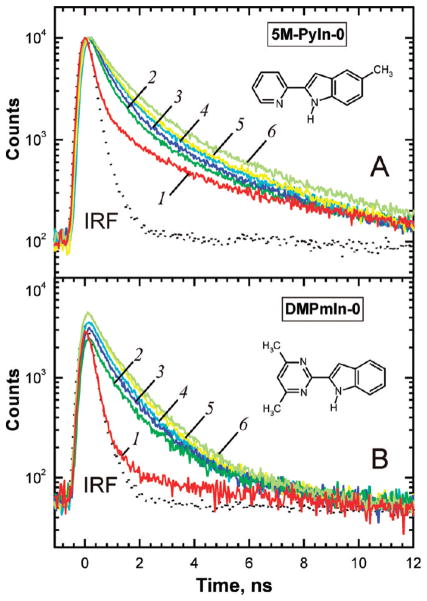
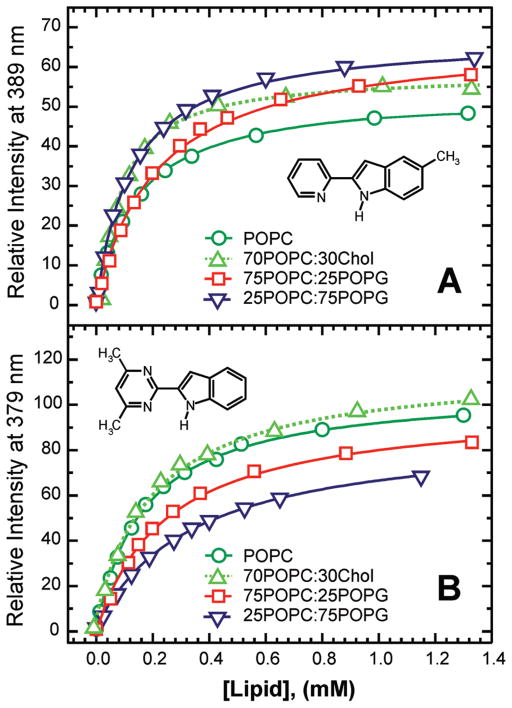
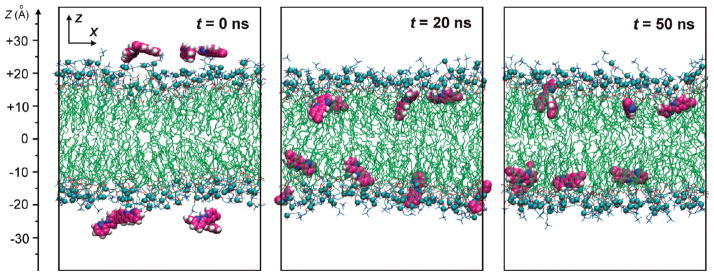
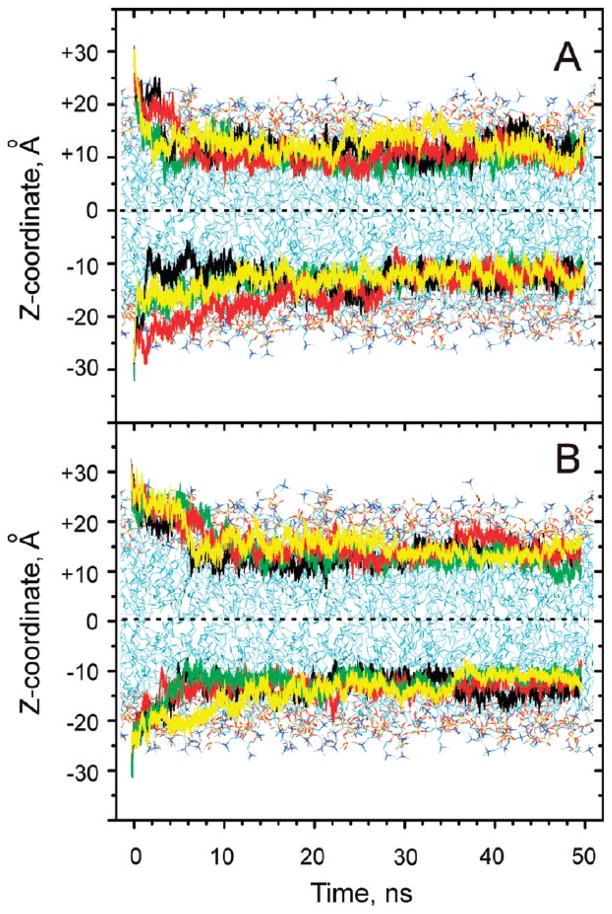
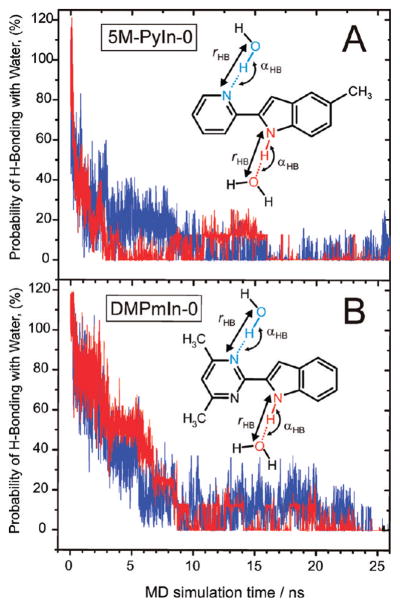
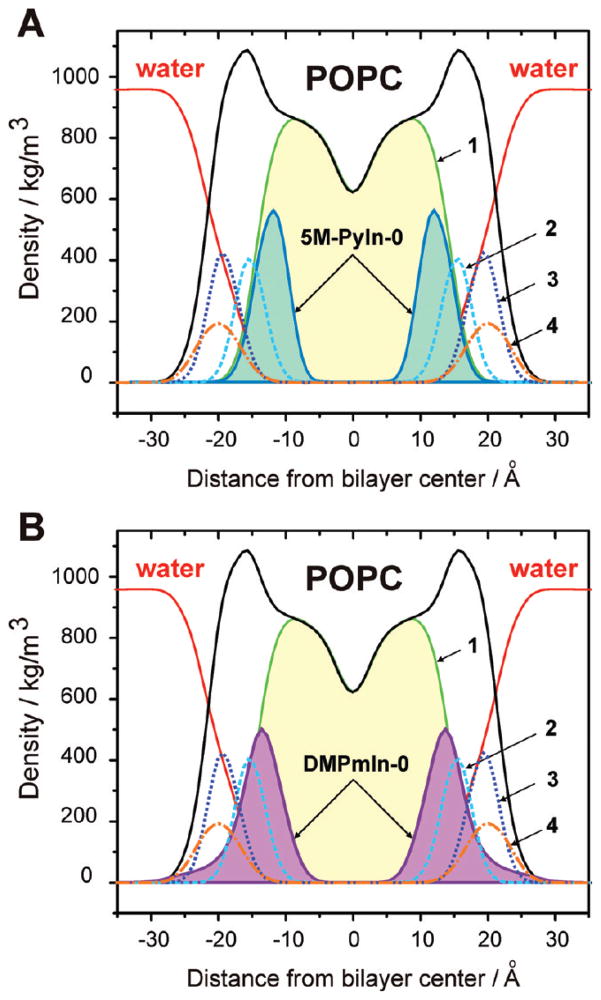
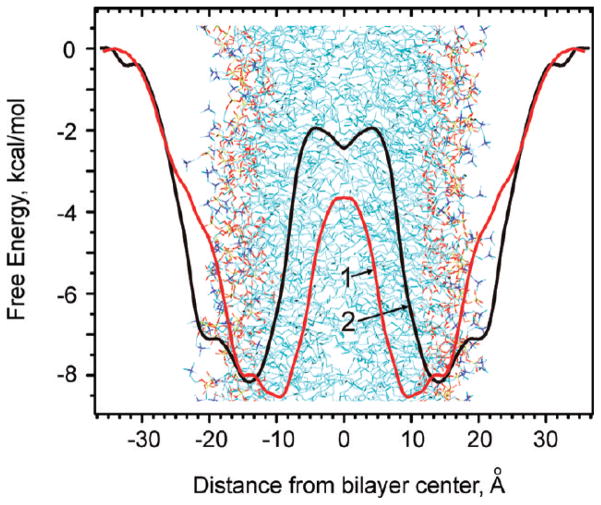
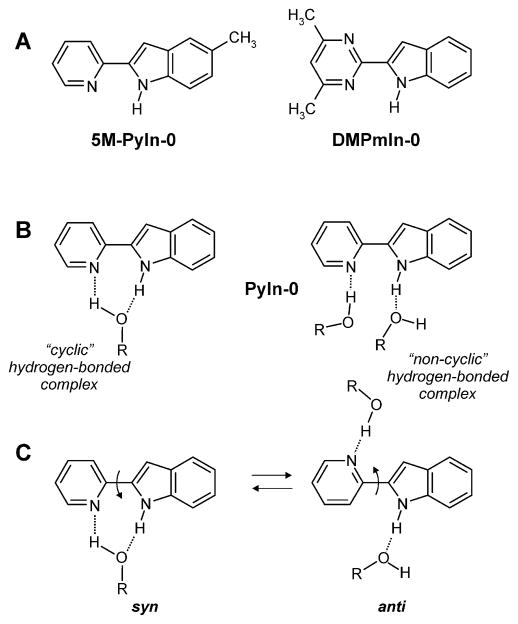
Fluorescence of environment-sensitive dyes is widely applied to monitor local structure and solvation dynamics of biomolecules. It has been shown that, in comparison with a parent indole fluorophore, fluorescence of 2-(2'-pyridyl)-5-methylindole (5M-PyIn-0) and 2-[2'-(4',6'-dimethylpyrimidyl)]-indole (DMPmIn-0) is remarkably sensitive to hydrogen bonding with protic partners. Strong fluorescence, observed for these compounds in nonpolar and polar aprotic solvents, is efficiently quenched in aqueous solution. This study demonstrates that 5M-PyIn-0 and DMPmIn-0, which are almost nonemitting in aqueous solution, become highly fluorescent upon titrating with phospholipid vesicles. The fluorescence enhancement is accompanied by a significant blue shift of emission maximum. The Gibbs free energy of membrane partitioning, measured by the increase in the steady-state fluorescence intensities during transfer from an aqueous environment to a lipid bilayer, is very favorable for both compounds, being in a range from -7.1 to -8.0 kcal/mol and depending only slightly on lipid composition of the membrane. The fluorescence enhancement upon membrane partitioning is indicative of the loss of the specific hydrogen-bonding interactions between the excited fluorophore and water molecules, causing efficient fluorescence quenching in bulk water. This conclusion is supported by atomistic molecular dynamics (MD) simulations, demonstrating that both 5M-PyIn-0 and DMPmIn-0 bind rapidly and partition deeply into a lipid bilayer. MD simulations also show a rapid, nanosecond-scale decrease in the probability of solute-solvent hydrogen bonding during passive diffusion of the probe molecules from bulk water into a lipid bilayer. At equilibrium conditions, both 5M-PyIn-0 and DMPmIn-0 prefer deep localization within the hydrophobic, water-free region of the bilayer. A free energy profile of penetration across a bilayer estimated using MD umbrella sampling shows that both indole derivatives favor residence in a rather wide potential energy well located 10-15 Å from the bilayer center.


Figures

Figure 1
Figure 1
Examples of changes in the fluorescence spectra of 5M-PyIn-0 (A) and DMPmIn-0 (B) occurring upon titration with lipid vesicles. The enhancement of fluorescence is observed upon partitioning of the probe molecules in a lipid membrane. This enhancement is also accompanied by a blue shift of the emission maximum. The examples are shown for LUV composed of 25POPC/75POPG (see text). Concentration of the probes was 5–7 × 10⁻⁶ M, whereas the LUV concentration in the solution was varied from C = 0 to 2 mM. All the fluorescence spectra were measured in 50 mM sodium phosphate buffer at pH 8 with excitation at 313 nm. The spectra were corrected by subtracting scattering and background fluorescence.
Figure 2
Figure 2
A blue shift of the maxima of the fluorescence spectra of 5M-PyIn-0, observed upon titration with lipid vesicles, indicates partitioning of probe molecules from the aqueous solution into a hydrophobic membrane environment. The fluorescence spectra were normalized for the same intensity (see Figure 1 for more details). The spectra were recorded in 50 mM sodium phosphate buffer at pH 8 for different LUV concentrations: (1) no LUV and (2) 0.01, (3) 0.1, (4) 0.5, and (5) 2.5 mM, respectively.
Figure 3
Figure 3
Fluorescence decays of 5M-PyIn-0 and DMPmIn-0 in sodium phosphate buffer at pH 8 were measured in the absence and in the presence of POPC vesicles. (A) 5M-PyIn-0, vesicle concentration and double exponential fitting parameters are given. The longer-lived component of curves 2–6 was fixed to 3.1 ns during the deconvolution fitting; 1: no LUV, A1 = 0.94, τ1 < 0.1 ns, A2 = 0.06, τ2 = 3.1 ns. 2: 0.01 mM LUV, A1 = 0.83, τ1 = 0.77 ns, A2 = 0.17, τ2 = 3.1 ns. 3: 0.03 mM LUV, A1 = 0.80, τ1 = 0.78 ns, A2 = 0.20, τ2 = 3.1 ns. 4: 0.07 mM LUV, A1 = 0.80, τ1 = 0.82 ns, A2 = 0.20, τ2 = 3.1 ns. 5: 0.14 mM LUV, A1 = 0.78, τ1 = 0.84 ns, A2 = 0.22, τ2 = 3.1 ns. 6: 1.3 mM LUV, A1 = 0.76, τ1 = 0.88 ns, A2 = 0.24, τ2 = 3.1 ns. (B) DMPmIn-0; fluorescence decays 2–6 were well fitted using a single lifetime of 1.25 ns. 1: no LUV, τ<0.1 ns. 2: 0.015 mM. 3: 0.03 mM. 4: 0.05 mM. 5: 0.075 mM. 6: 1.23 mM.
Figure 4
Figure 4
Relative fluorescence intensities of 5M-PyIn-0 (A) and DMPmIn-0 (B) in the 50 mM sodium phosphate buffer at pH 8 are plotted as a function of the concentration of lipid vesicles. Relative intensities (Ii/I0, Ii is the fluorescence intensity in the presence of LUV, and I0 is the intensity in the buffer solution with no LUV) were determined at fixed wavelengths of 389 and 379 nm for 5M-PyIn-0 and DMPmIn-0, respectively (see Figure 1 for more details). The fluorescence intensities were corrected by subtracting the scattering and background fluorescence. The lipid compositions of the vesicles POPC, 70POPC/30Chol, 75POPC/25POPG, and 25POPC/75POPG are shown by green circles (○), olive top triangles (△), red squares (□), and blue bottom triangles (▽), respectively. Titration profiles were fitted to eq 1 to determine the partition coefficient Kp.
Figure 5
Figure 5
MD simulations of partitioning dynamics of 5M-PyIn-0 in a POPC bilayer are shown for different simulation periods. Snapshots of the MD system consisting of a hydrated POPC bilayer and eight molecules of 5M-PyIn-0, with four molecules on the top and bottom leaflet of the bilayer, are taken after t = 0, 20, and 50 ns of MD sampling. The molecules of 5M-PyIn-0 are drawn in van der Waals representation. Phosphorus atoms of POPC molecules are shown by cyan balls. For clarity, water molecules are not shown.
Figure 6
Figure 6
Kinetics of partitioning of 5M-PyIn-0 (A) and DMPmIn-0 (B) in a POPC bilayer was monitored by COM of the probe molecules. The COM distances were calculated from the bilayer center along the z-axis for each of the eight probe molecules as a function of MD simulation time. For clarity, the COM distances for the four molecules on the top and bottom leaflet of the bilayer are black, green, red, and yellow and schematically superimposed on a bilayer snapshot.
Figure 7
Figure 7
Time evolution of hydrogen-bonding interactions between either 5M-PyIn-0 (A) or DMPmIn-0 (B) and water molecules is shown as a function of MD simulation time. Probability of the formation of a hydrogen bond is calculated and averaged for all the eight probe molecules (see Figure 5 for more details). A rapid decrease in the probability of hydrogen bonding between probe and water molecules indicates rapid transfer of the probe molecules from bulk water to a hydrophobic, water-free region of a POPC bilayer. Two kinds of hydrogen bonds, which are thought to contribute to the fluorescence quenching of the probe in water, were monitored during MD sampling: (i) a H-bond between NH of the indole moiety and water oxygen atoms (red) and between the nitrogen atom of pyridine/pyrimidine rings and water oxygens (OH) (blue).
Figure 8
Figure 8
Mass density distributions of 5M-PyIn-0 (A) and DMPmIn-0 (B) across a POPC bilayer. The density distribution of water (red solid line) and a whole POPC bilayer (black solid) and its individual components are shown, as are (1, green solid) alkyl chains, (2, cyan dash) carbonyls, (3, blue dot) choline moieties, (4, orange dash-dot) phosphate groups. To improve visualization, the mass density of 5M-PyIn-0 and DMPmIn-0 is scaled by a factor of 10. All the distribution profiles are averaged for the last 40 ns of the MD sampling period. The distributions are plotted with respect to the center of the z axis of the MD simulation box (see Figure 5 for more details).
Figure 9
Figure 9
Potential of mean constraint force for 5M-PyIn-0 (1) and DMPmIn-0 (2) in a POPC bilayer. The PMFs are calculated for the center of mass of the probe molecule relative to the center of mass of the bilayer. The PMFs are set to zero in the bulk water phase. For visualization clarity, the PMFs are schematically superimposed on a bilayer snapshot.
SCHEME 1
SCHEME 1
Structures of 2-(2′-Pyridyl)-5-methyl-indole (5M-PyIn-0) and 2-[2′-(4′,6′-Dimethylpyrimidyl)]-indole (DMPmIn-0) (A); Parent Compound 2′-Pyridylindole (PyIn-0) and Its Hydrogen-Bonded Complexes with Protic Solvent Molecules: (B) Structure of “Cyclic” and “Noncyclic” Hydrogen-Bonded Complexes of PyIn-0 with Solvent; (C) Hydrogen-Bonded Induced syn–anti Rotamerization in PyIn-0

References

    1. Taylor CL, El-Bayoumi MA, Kasha M. Proc Natl Acad Sci USA. 1969;63:253–260. - PMC - PubMed
    1. Zimmer M. Chem Rev. 2002;102:759–781. - PubMed
    1. Pakhomov AA, Martynov VI. Chem Biol. 2008;15:755–764. - PubMed
    1. Vendrell O, Gelabert R, Moreno M, Lluch JM. J Phys Chem B. 2008;112:13443–13452. - PubMed
    1. Herbich J, Hung CY, Thummel RP, Waluk J. J Am Chem Soc. 1996;118:3508–3518.

Publication types

MeSH terms