

Candidate genes versus genome-wide associations: which are better for detecting genetic susceptibility to infectious disease?
- PMID: 20926441
- PMCID: PMC3049081
- DOI: 10.1098/rspb.2010.1920
Candidate genes versus genome-wide associations: which are better for detecting genetic susceptibility to infectious disease?
Abstract
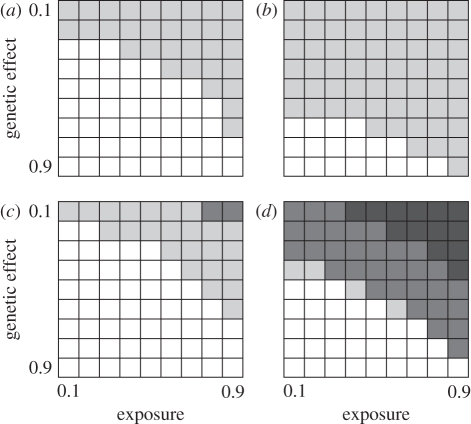
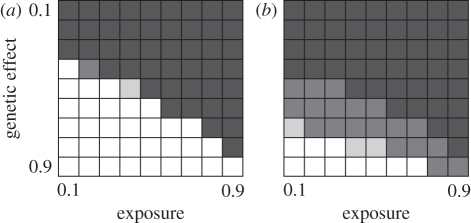
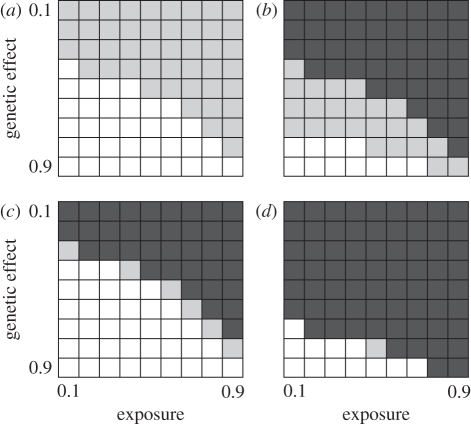
Technological developments allow increasing numbers of markers to be deployed in case-control studies searching for genetic factors that influence disease susceptibility. However, with vast numbers of markers, true 'hits' may become lost in a sea of false positives. This problem may be particularly acute for infectious diseases, where the control group may contain unexposed individuals with susceptible genotypes. To explore this effect, we used a series of stochastic simulations to model a scenario based loosely on bovine tuberculosis. We find that a candidate gene approach tends to have greater statistical power than studies that use large numbers of single nucleotide polymorphisms (SNPs) in genome-wide association tests, almost regardless of the number of SNPs deployed. Both approaches struggle to detect genetic effects when these are either weak or if an appreciable proportion of individuals are unexposed to the disease when modest sample sizes (250 each of cases and controls) are used, but these issues are largely mitigated if sample sizes can be increased to 2000 or more of each class. We conclude that the power of any genotype-phenotype association test will be improved if the sampling strategy takes account of exposure heterogeneity, though this is not necessarily easy to do.
Figures
References
-
- Hinds D. A., Stuve L. L., Nilsen G. B., Halperin E., Eskin E., Balinger D. G., Frazer K. A., Cox D. R. 2005. Whole-genome patterns of common DNA variation in three human populations. Science 307, 1072–107910.1126/science.1105436 (doi:10.1126/science.1105436) - DOI - DOI - PubMed
-
- The International HapMap Consortium 2007. A second generation human haplotype map of over 3.1 million SNPs. Nature 449, 851–85310.1038/nature06258 (doi:10.1038/nature06258) - DOI - DOI - PMC - PubMed
-
- McCarthy M. I., Abecasis G. R., Cardon L. R., Goldstein D. B., Little J., Ionnidis J. P. A., Hirschhorn J. N. 2008. Genome-wide association studies for complex traits: consensus, uncertainty and challenges. Nat. Rev. Genet. 9, 356–36910.1038/nrg2344 (doi:10.1038/nrg2344) - DOI - DOI - PubMed
-
- Schulze T. G., McMahon F. J. 2002. Genetic association mapping at the crossroads: which test and why? Overview and practical guidelines. Am. J. Med. Genet. (Neuropsych. Genet.) 114, 1–1110.1002/ajmg.10042 (doi:10.1002/ajmg.10042) - DOI - DOI - PubMed
-
- Altet L., Francimo O., Solano-Gallego L., Renier C., Sánchez A. 2002. Mapping and sequencing of the canine NRAMP1 gene and identification of mutations in Leishmaniasis-susceptible dogs. Infect. Immun. 70, 2763–277110.1128/IAI.70.6.2763-2771.2002 (doi:10.1128/IAI.70.6.2763-2771.2002) - DOI - DOI - PMC - PubMed
MeSH terms
Substances
LinkOut - more resources
Full Text Sources