

Variation in rates of caesarean section among English NHS trusts after accounting for maternal and clinical risk: cross sectional study
- PMID: 20926490
- PMCID: PMC2950923
- DOI: 10.1136/bmj.c5065
Variation in rates of caesarean section among English NHS trusts after accounting for maternal and clinical risk: cross sectional study
Abstract
Objective: To determine whether the variation in unadjusted rates of caesarean section derived from routine data in NHS trusts in England can be explained by maternal characteristics and clinical risk factors.
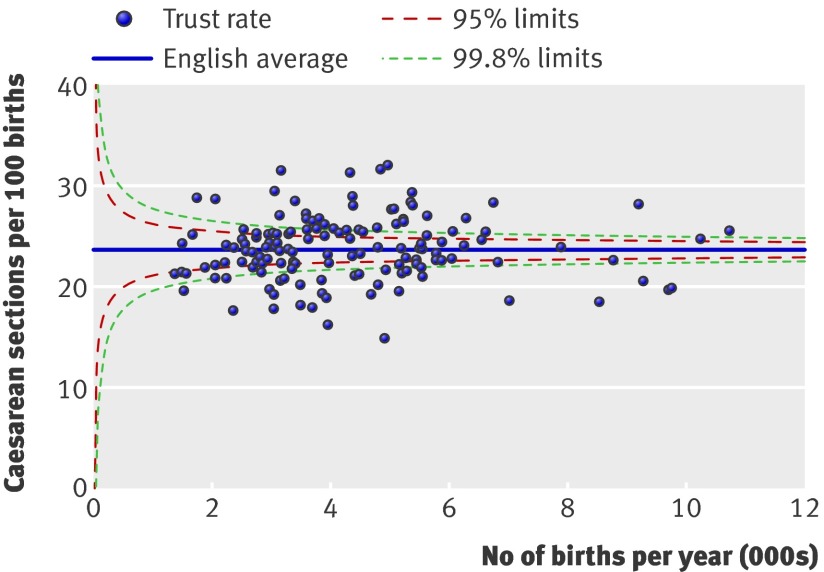
Design: A cross sectional analysis using routinely collected hospital episode statistics was performed. A multiple logistic regression model was used to estimate the likelihood of women having a caesarean section given their maternal characteristics (age, ethnicity, parity, and socioeconomic deprivation) and clinical risk factors (previous caesarean section, breech presentation, and fetal distress). Adjusted rates of caesarean section for each NHS trust were produced from this model.
Setting: 146 English NHS trusts. Population Women aged between 15 and 44 years with a singleton birth between 1 January and 31 December 2008.
Main outcome measure: Rate of caesarean sections per 100 births (live or stillborn).
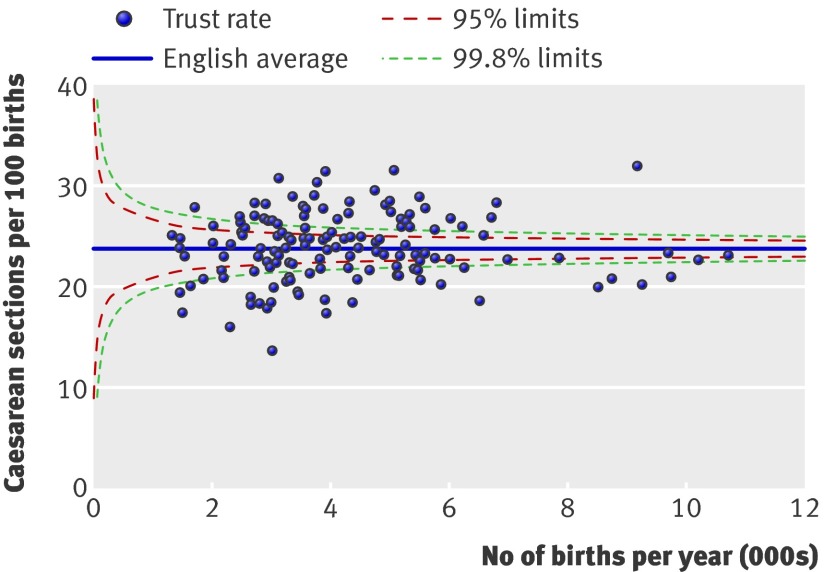
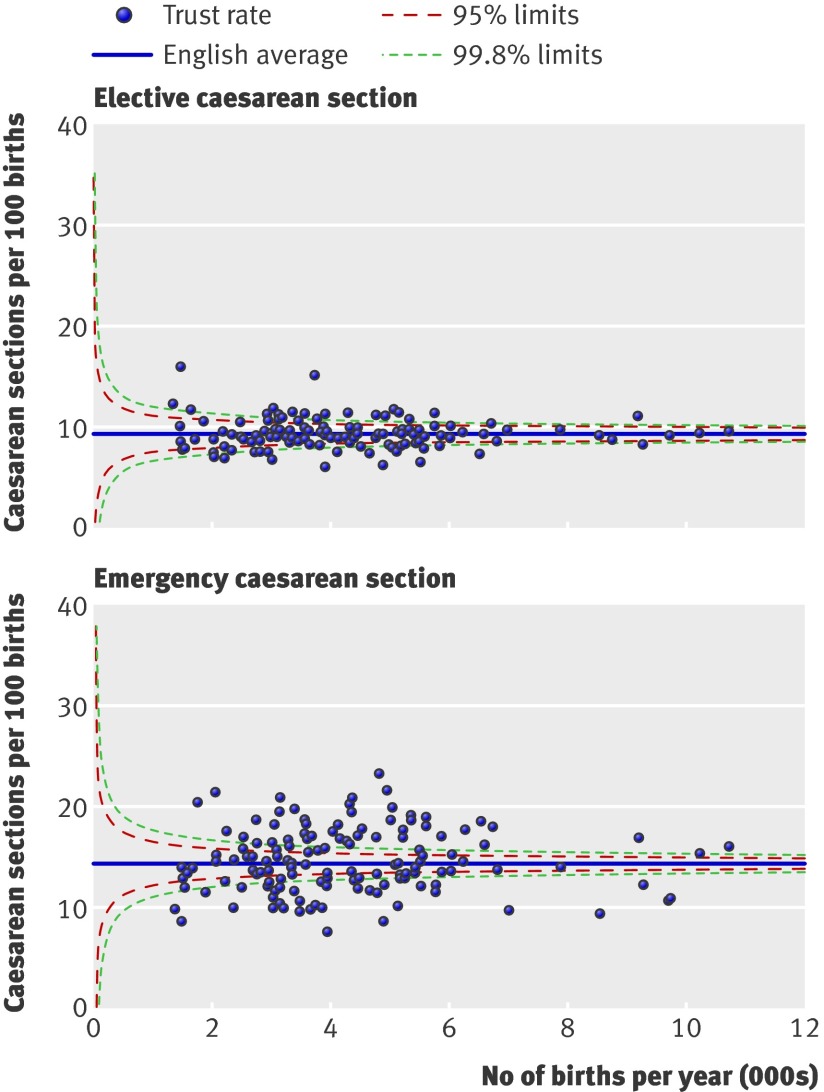
Results: Among 620 604 singleton births, 147 726 (23.8%) were delivered by caesarean section. Women were more likely to have a caesarean section if they had had one previously (70.8%) or had a baby with breech presentation (89.8%). Unadjusted rates of caesarean section among the NHS trusts ranged from 13.6% to 31.9%. Trusts differed in their patient populations, but adjusted rates still ranged from 14.9% to 32.1%. Rates of emergency caesarean section varied between trusts more than rates of elective caesarean section.
Conclusion: Characteristics of women delivering at NHS trusts differ, and comparing unadjusted rates of caesarean section should be avoided. Adjusted rates of caesarean section still vary considerably and attempts to reduce this variation should examine issues linked to emergency caesarean section.
Conflict of interest statement
Competing interests: All authors have completed the Unified Competing Interest form at
Figures

Comment in
-
Variation in caesarean delivery rates.BMJ. 2010 Oct 6;341:c5255. doi: 10.1136/bmj.c5255. BMJ. 2010. PMID: 20926492 No abstract available.
-
Caesarean section rates across English trusts.Midwives. 2010 Dec:20. Midwives. 2010. PMID: 24888133 No abstract available.
References
-
- World Health Organization. Appropriate technology for birth. Lancet 1985;2:436-7. - PubMed
-
- Althabe F, Sosa C, Belizán JM, Gibbons L, Jacquerioz F, Bergel E. Cesarean section rates and maternal and neonatal mortality in low-, medium-, and high-income countries: an ecological study. Birth 2006;33:270-7. - PubMed
-
- National Collaborating Centre for Women’s and Children’s Health. Caesarean section. National Institute for Clinical Excellence, 2004. - PubMed
-
- Paranjothy S, Frost C, Thomas J. How much variation in CS rates can be explained by case mix differences? BJOG 2005;112:658-66. - PubMed
Publication types
MeSH terms
Grants and funding
LinkOut - more resources
Full Text Sources
Other Literature Sources
Medical