. 2010 Dec;104(6):3476-93.
doi: 10.1152/jn.00593.2010. Epub 2010 Oct 6.

Sleep and synaptic renormalization: a computational study

Affiliations

Sleep and synaptic renormalization: a computational study

Umberto Olcese et al. J Neurophysiol. 2010 Dec.

Abstract

Recent evidence indicates that net synaptic strength in cortical and other networks increases during wakefulness and returns to a baseline level during sleep. These homeostatic changes in synaptic strength are accompanied by corresponding changes in sleep slow wave activity (SWA) and in neuronal firing rates and synchrony. Other evidence indicates that sleep is associated with an initial reactivation of learned firing patterns that decreases over time. Finally, sleep can enhance performance of learned tasks, aid memory consolidation, and desaturate the ability to learn. Using a large-scale model of the corticothalamic system equipped with a spike-timing dependent learning rule, in agreement with experimental results, we demonstrate a net increase in synaptic strength in the waking mode associated with an increase in neuronal firing rates and synchrony. In the sleep mode, net synaptic strength decreases accompanied by a decline in SWA. We show that the interplay of activity and plasticity changes implements a control loop yielding an exponential, self-limiting renormalization of synaptic strength. Moreover, when the model "learns" a sequence of activation during waking, the learned sequence is preferentially reactivated during sleep, and reactivation declines over time. Finally, sleep-dependent synaptic renormalization leads to increased signal-to-noise ratios, increased resistance to interference, and desaturation of learning capabilities. Although the specific mechanisms implemented in the model cannot capture the variety and complexity of biological substrates, and will need modifications in line with future evidence, the present simulations provide a unified, parsimonious account for diverse experimental findings coming from molecular, electrophysiological, and behavioral approaches.


Figures

Fig. 1.
Fig. 1.
Model architecture. A: general architecture of the large-scale computational model. Three thalamocortical regions are modeled, each made up of several layers and cell types. Each thalamocortical region is subdivided into a cortical (C1, C2, C3) and a thalamic area (T1, T2, T3). Cortical areas are further characterized into three layers (L2-3, L4, L5-6), while thalamic areas contain a proper thalamic layer (TN) and a thalamic reticular nucles layer (TRN). Each layer is a 30 × 30 grid, where each point in the grid may contain ≥1 neurons. For the cortical layer, 3 neurons are present (2 excitatory and 1 inhibitory), the thalamic layer instead has 2 neurons per grid point (1 excitatory and 1 inhibitory), thalamic reticular layers only 1 inhibitory cell. Connections within the 2nd region are detailed in A, while general horizontal connections between cortico-thalamic regions are only outlined. More details about the model can be found in methods and in the supplementary material. B: intracellular membrane potential of a sample excitatory neuron during waking. Regular low-frequency activity is present, with an average membrane potential around −60 mV. C: intracellular membrane potential of a sample excitatory neuron during sleep. Membrane potential fluctuates between depolarized on states with firing activity and hyperpolarized off states with an average value of −80 mV and no spiking.
Fig. 2.
Fig. 2.
Connection strength and neural activity during waking and sleep. A: average connection strength (as a percentage of the initial value) during a waking session with spike-timing dependent plasticity (STDP) and high levels of arousal-promoting neuromodulators (both potentiation and depression are possible). Because the rate of change of connection strength depends on the arbitrary learning rate that was employed, time bins are employed as time units instead of seconds. Here 1 time bin correspond to 1 s of simulation. B: average connection strength (as a percentage of the initial value) during a sleep session with STDP biased toward depression by low levels of arousal-promoting neuromodulators. C: changes in firing rates during the waking session. D: changes in firing rates (calculated during on periods) for the sleep session. E: changes in slow wave activity (SWA; total power between 0.5 and 3 Hz computed over the average membrane potential) for the sleep session. F: average duration of on periods and off periods during early and late sleep. G: on-off and off-on transition synchrony for the 2 conditions. Transition synchrony is defined as the reciprocal of the latency of the 1st and last spike of each unit from the onset of population on or off periods, respectively. Each bar in C–E corresponds to 4 time bins (4 s of simulation time) to have enough data to compute firing rates and SWA. Values in C, D, F, and G are means + SE (20 neurons). Significant differences for each condition in F and G (P < 0.05, independent t-test) are marked (*). Note the exponential decline of average connection strength (least-square fitting, r2 = 0.99), firing rates and SWA during sleep, which is indicative the existence of a self-limiting homeostatic regulation process. Furthermore, all changes in network activity between conditions of high and low connection strength are similar to those reported in vivo between early and late sleep.
Fig. 3.
Fig. 3.
A model of homeostatic regulation of connection strength and firing activity. Following the results of our simulations, we developed a model of homeostatic regulation of connection strength and firing activity during non rapid eyes movement (NREM) sleep. Here connection strength (s) affects firing rates and synchrony (f) via an activity mechanism (A). During sleep, plasticity mechanisms (P) lead to a depression of synaptic strength (ds/dt) that is proportional to f. As an example strong average connection strength will lead to high firing rates and synchrony which, in turn, will strongly depress synapses, to bring the system back to baseline connectivity values. Conversely, when connections are renormalized, activity levels will not be able to induce significant plastic change and the system will reach an equilibrium point.
Fig. 4.
Fig. 4.
Changes in connectivity as a consequence of training and sleep. A: ratio between the strengths of 1-step forward connections (from patch A to B, from B to C, and so on) and the corresponding 1-step backward connections (from patch B to A, from C to B, and so on). Average connection strength between each pair of subsequent patches in the forward order is computed, then divided by the corresponding value in the opposite order. Training increase the forward/backward ratio by ∼60%. Renormalization during sleep further increases this ratio by ∼20%. A 2nd waking session—with or without subthreshold stimulation to take into account the role of spontaneous reactivation of neural circuits—does not further improves this ratio. B: effect of renormalization on the top and bottom 10% of all connections (their strength being ranked after training). Average value of each of the 2 groups of connections after training is normalized to 100. Strengthened connections are basically not affected by renormalization, while weak ones are significantly depressed. The weight dependency of the STDP rule helps explain the mechanism through which stored memories (for which strengthening is predominant) are consolidated during sleep. In all panels, *, significant differences between conditions (P < 0.05, independent t-test).
Fig. 5.
Fig. 5.
Changes in network response as a consequence of training and sleep. A: average firing rate in patches C (—) and A (- - -) after stimulation of patch B, for different conditions. Patch B was stimulated above threshold at time 0, patches A and C were administered a continuous subthreshold current injection (see methods for details) to increase their excitability. Within the 1st 200 ms after stimulation of patch B, a response can be seen in patches A and C. This response is the same at baseline; after training response increases more markedly in patch C than in patch A, and this difference is further increased by sleep-dependent renormalization, especially in the 1st 100 ms. Interference immediately after training (without an interposed sleep session) makes the responses in patches A and C more similar (i.e., reduces the SNR), while an interposed sleep session preserves the existing differences. B: changes in SNR index over previous conditions. Changes in SNR index are calculated as the ratio between average firing rates in patches C and A in the 1st 200 ms after stimulation of patch B. Training increases the SNR index by 30%, sleep-dependent renormalization by an additional 15%. C: changes in SNR index (computed as in B) as a consequence of an interference learning session, respectively, with or without an interposed sleep session. SNR index is decreased by 5% if interference occurs immediately after training but is not modified if a sleep session is interposed between training and interference. *, average values statistically different from 0 (P < 0.05, 1 sample t-test).
Fig. 6.
Fig. 6.
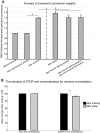
Reactivation of the training sequence as a consequence of training and sleep. A: ratio of repeating sequences during NREM sleep. This is the ratio of sequences of spikes in all 5 patches that correspond to the training sequence, compared with all detected sequences (see methods for details on how the ratio is computed). This ratio, in accordance with experimental results, significantly increases in NREM sleep session immediately after training but decreases to baseline values after sleep-dependent renormalization, suggesting that reactivation of sequences is linked to the average connection strength. B: same as A computed during waking sessions before and after training, with and without subthreshold stimulation. The ratio of repeating sequence during waking increases after training only if neuronal excitability is increased by subthreshold stimulation, simulating therefore the role of events such as sharp-wave ripples in eliciting circuit reactivation. *, significant differences between conditions (P < 0.05, independent t-test, each experiment was repeated 3 times).

References

    1. Abbott LF, Nelson SB. Synaptic plasticity: taming the beast. Nat Neurosci 3, Suppl: 1178–1183, 2000 - PubMed
    1. Achermann P, Borbély AA. Mathematical models of sleep regulation. Front Biosci 8: s683–693, 2003 - PubMed
    1. Achermann P, Dijk DJ, Brunner DP, Borbély AA. A model of human sleep homeostasis based on EEG slow-wave activity: quantitative comparison of data and simulations. Brain Res Bull 31: 97–113, 1993 - PubMed
    1. Aeschbach D, Cutler AJ, Ronda JM. A role for non-rapid-eye-movement sleep homeostasis in perceptual learning. J Neurosci 28: 2766–2772, 2008 - PMC - PubMed
    1. Amzica F, Steriade M. Electrophysiological correlates of sleep delta waves. Electroencephalogr Clin Neurophysiol 107: 69–83, 1998 - PubMed

Publication types

MeSH terms

LinkOut - more resources