. 2010 Oct 6;30(40):13211-9.
doi: 10.1523/JNEUROSCI.2532-10.2010.

Mapping of cortical activity in the first two decades of life: a high-density sleep electroencephalogram study

Affiliations

Mapping of cortical activity in the first two decades of life: a high-density sleep electroencephalogram study

Salomé Kurth et al. J Neurosci. .

Abstract

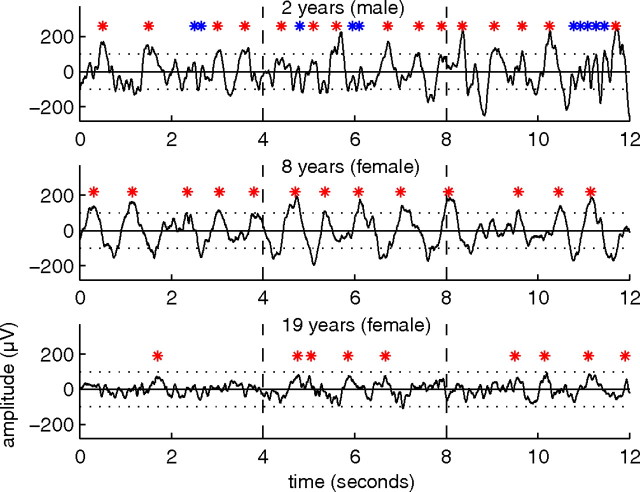
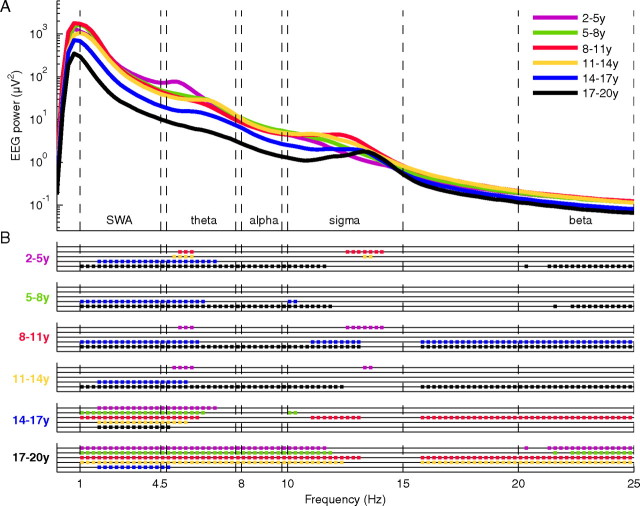
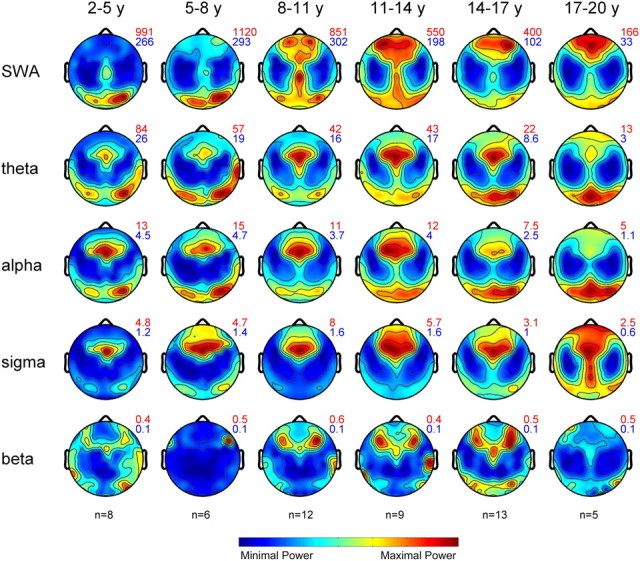
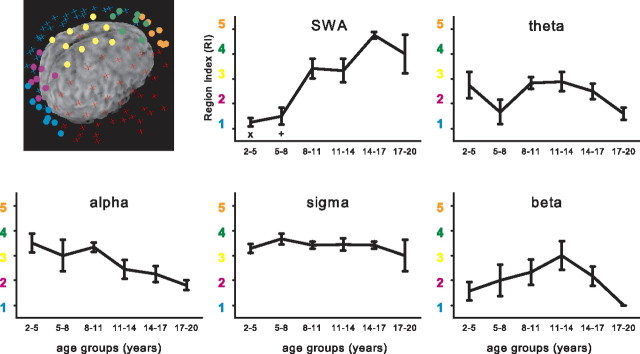
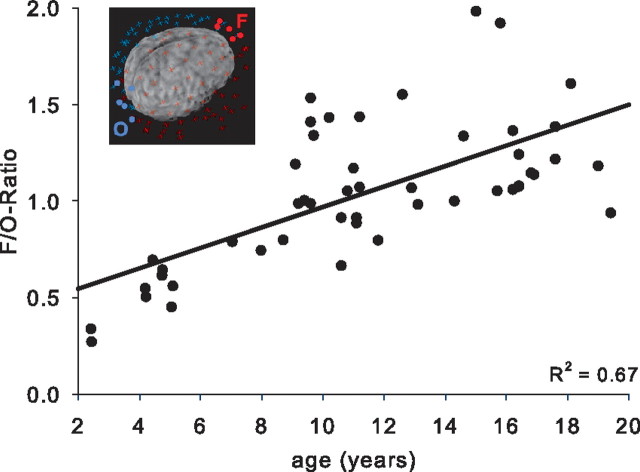
Evidence that electroencephalography (EEG) slow-wave activity (SWA) (EEG spectral power in the 1-4.5 Hz band) during non-rapid eye movement sleep (NREM) reflects plastic changes is increasing (Tononi and Cirelli, 2006). Regional assessment of gray matter development from neuroimaging studies reveals a posteroanterior trajectory of cortical maturation in the first three decades of life (Shaw et al., 2008). Our aim was to test whether this regional cortical maturation is reflected in regional changes of sleep SWA. We evaluated all-night high-density EEG (128 channels) in 55 healthy human subjects (2.4-19.4 years) and assessed age-related changes in NREM sleep topography. As in adults, we observed frequency-specific topographical distributions of sleep EEG power in all subjects. However, from early childhood to late adolescence, the location on the scalp showing maximal SWA underwent a shift from posterior to anterior regions. This shift along the posteroanterior axis was only present in the SWA frequency range and remained stable across the night. Changes in the topography of SWA during sleep parallel neuroimaging study findings indicating cortical maturation starts early in posterior areas and spreads rostrally over the frontal cortex. Thus, SWA might reflect the underlying processes of cortical maturation. In the future, sleep SWA assessments may be used as a clinical tool to detect aberrations in cortical maturation.


Figures

Figure 1.
Figure 1.
Tracings of slow-wave sleep for different ages. Twelve second EEG segments of slow-wave sleep in the first sleep cycle in three subjects of different ages (C3A2 derivation). Red stars indicate slow waves, and blue stars theta waves.
Figure 2.
Figure 2.
A, EEG power spectra during early NREM sleep. Average of all electrodes of the first 60 min NREM sleep stages 2 and 3 in six age groups (purple, 2–5 years; green, 5–8 years; red, 8–11 years; yellow, 11–14 years; blue, 14–17 years; black, 17–20 years; n = 53). Significant ANOVAs (see Materials and Methods) (F = 2.5–25.7, df = 5) were followed by groupwise comparisons as indicated in B. B, Post hoc Scheffé's testing calculated for each 0.25 Hz bin and significant group differences indicated as dots (p < 0.05). Comparisons are color coded. Groups labeled on the ordinate were compared with color-coded groups for each particular frequency bin. A later time window of sleep showed a similar pattern of age group differences (supplemental data, available at www.jneurosci.org as supplemental material).
Figure 3.
Figure 3.
Maps of EEG power during NREM sleep. Topographical distribution of NREM sleep EEG power for the defined age groups and frequency ranges (n = 53). Maps are based on 109 derivations from the first 60 min of NREM sleep stages 2 and 3. Maps were normalized for each individual and then averaged for each age group. Values are color coded (maxima in red, minima in blue) and plotted on the planar projection of the hemispheric scalp model. To optimize contrast, each map was proportionally scaled, and values between the electrodes were interpolated. At the top right of the maps, numbers indicate maxima and minima (in square microvolts) for each plot.
Figure 4.
Figure 4.
Region index for selected frequency bands. Five cortical subregions along the inion–nasion axis are illustrated as clusters of colored electrodes (blue, RI1; purple, RI2; yellow, RI3; green, RI4; orange, RI5; the remaining electrodes are illustrated by turquoise and red crosses). For each subject, the location of maximal power over all clusters was determined. Depending on the cluster in which that maximal power value occurred, a value (RI) from 1 to 5 was given. The electrodes were digitized and coregistered with the subject's magnetic resonance images. RIs for age group are presented for the selected frequency bands. Two-way ANOVA with factors age group and time (early or late sleep; see legend of Fig. 2C) showed significant effects for age group in the SWA range (p < 0.05, F = 13.8, df = 5), theta (p < 0.05, F = 4.5, df = 5), and alpha (p < 0.05, F = 7.2, df = 5) bands, whereas the factor time was not significant and no interaction was found. Post hoc testing revealed a significant main effect for age group for the SWA range (Scheffé's tests, p < 0.05; x indicates that 2–5 years differ significantly from 8–11, 11–14, 14–17, and 17–20 years; + indicates that 5–8 years differ significantly from 8–11, 14–17, and 17–20 years).
Figure 5.
Figure 5.
F/O ratio across age. SWA within a cluster of five electrodes in the frontal region (F) was averaged and divided by the value of five occipital electrodes (O). The cluster of electrodes included in the F/O ratio is illustrated for an older adolescent (inset). The SWA F/O ratio correlated significantly with age (p < 0.001).

References

    1. Attwell D, Laughlin SB. An energy budget for signaling in the grey matter of the brain. J Cereb Blood Flow Metab. 2001;21:1133–1145. - PubMed
    1. Borbély AA, Achermann P. Homeostasis of human sleep and models of sleep regulation. In: Kryger MH, Roth T, Dement WC, editors. Principles and practice of sleep medicine. Philadelphia: Saunders; 2000. pp. 377–390.
    1. Born J, Rasch B, Gais S. Sleep to remember. Neuroscientist. 2006;12:410–424. - PubMed
    1. Boyke J, Driemeyer J, Gaser C, Büchel C, May A. Training-induced brain structure changes in the elderly. J Neurosci. 2008;28:7031–7035. - PMC - PubMed
    1. Brecelj J. From immature to mature pattern ERG and VEP. Doc Ophthalmol. 2003;107:215–224. - PubMed

Publication types