. 2010 Oct 6;30(40):13281-90.
doi: 10.1523/JNEUROSCI.2528-10.2010.

Control of exocytosis by synaptotagmins and otoferlin in auditory hair cells

Affiliations

Control of exocytosis by synaptotagmins and otoferlin in auditory hair cells

Maryline Beurg et al. J Neurosci. .

Abstract

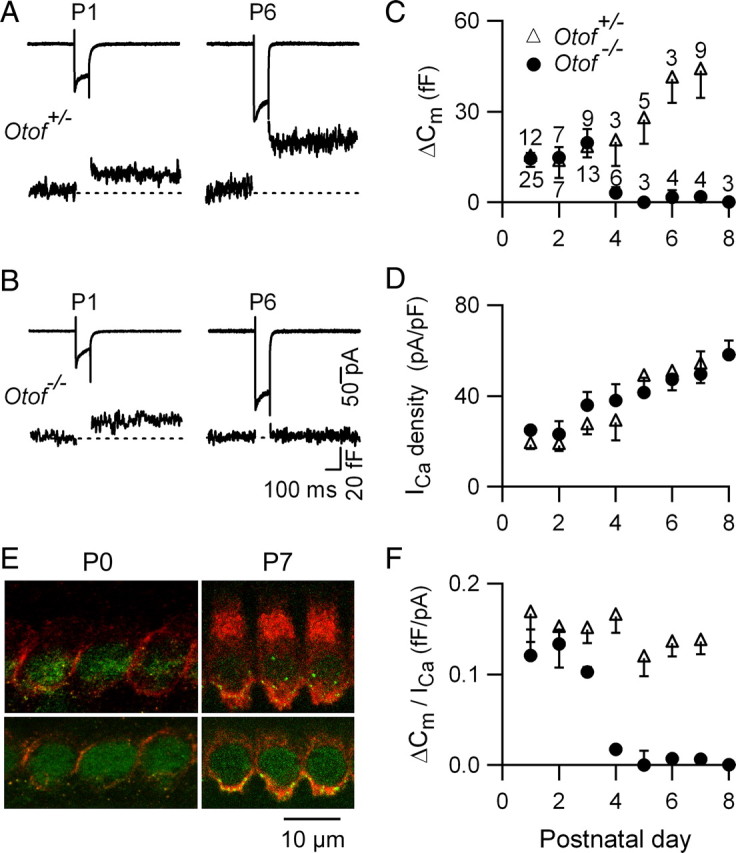
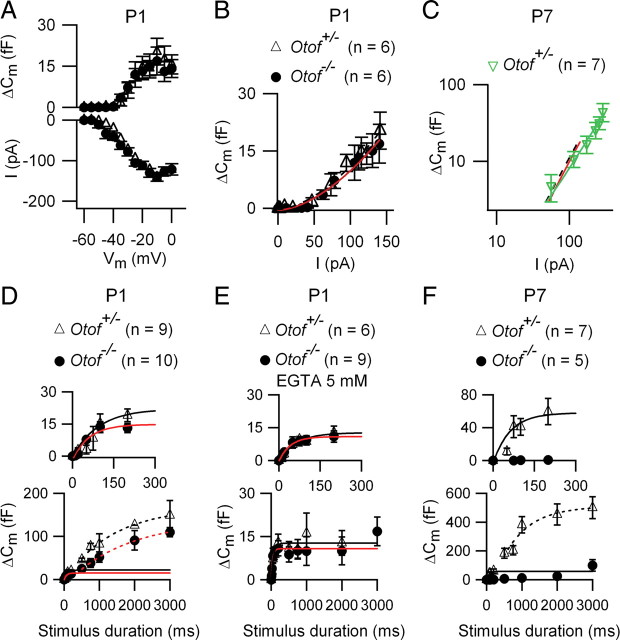
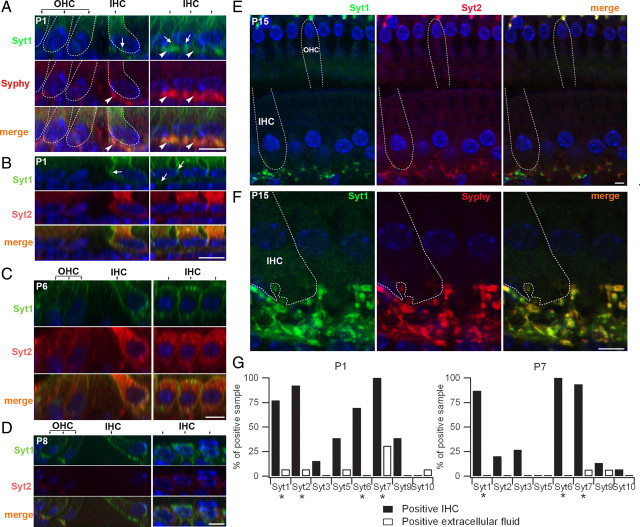
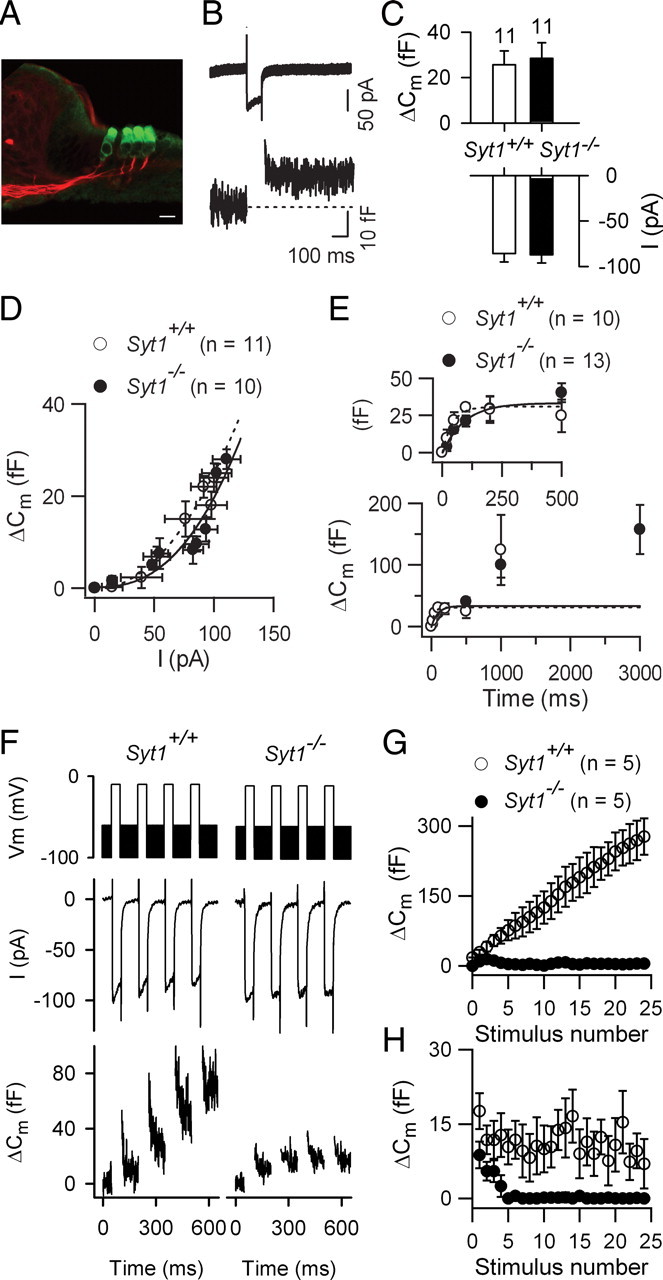
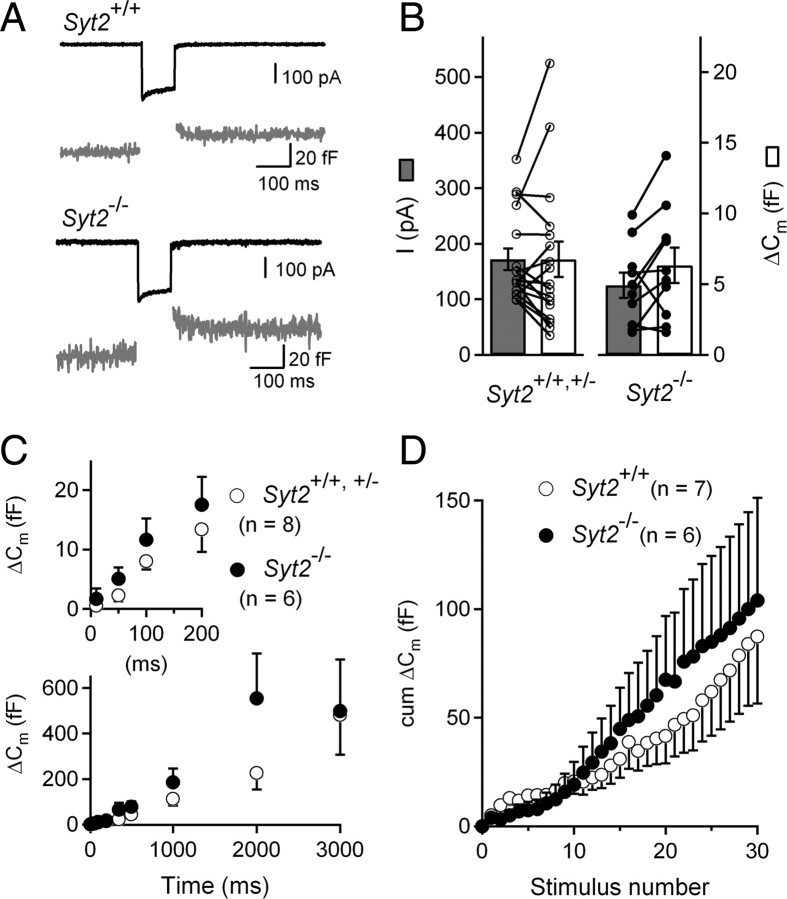
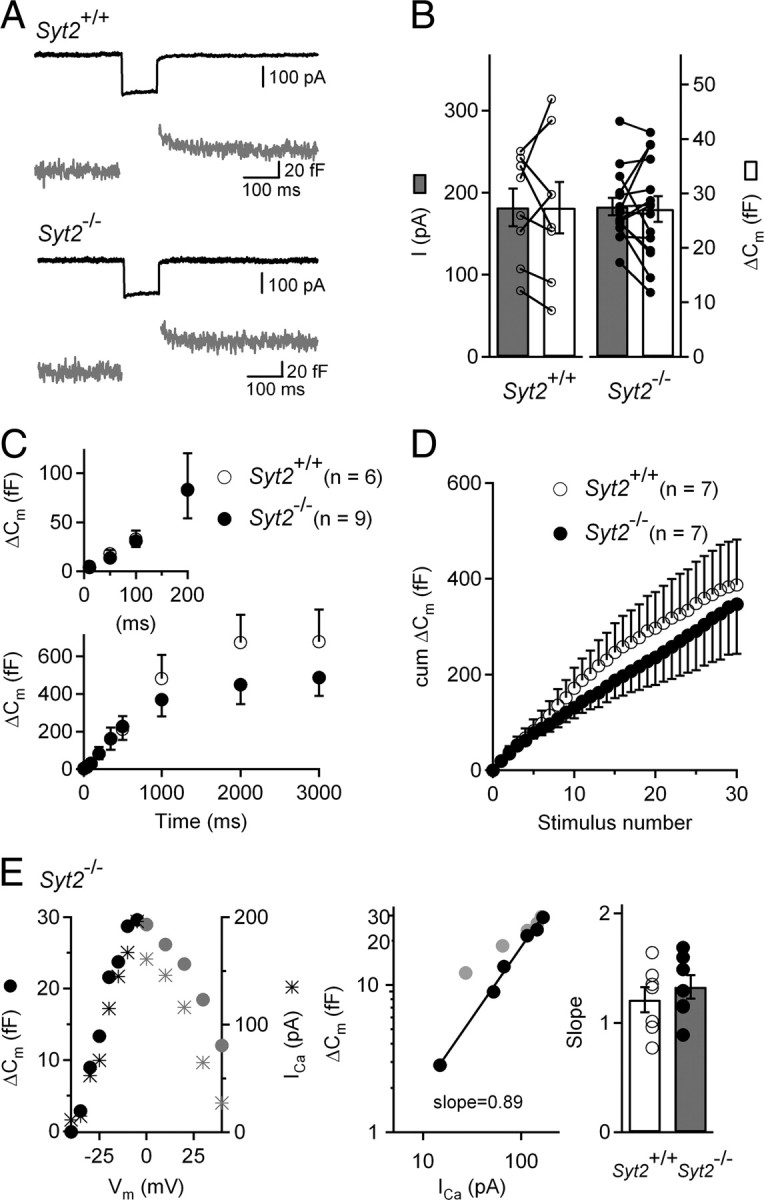
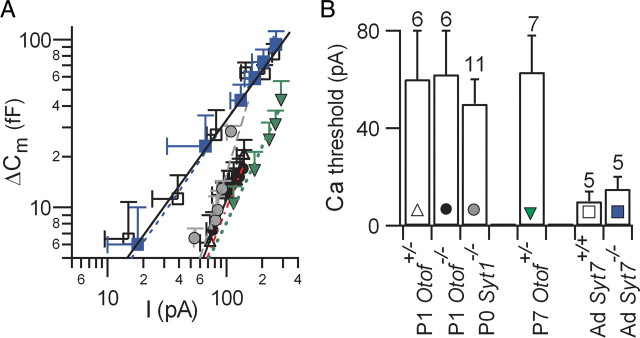
In pre-hearing mice, vesicle exocytosis at cochlear inner hair cell (IHC) ribbon synapses is triggered by spontaneous Ca(2+) spikes. At the onset of hearing, IHC exocytosis is then exclusively driven by graded potentials, and is characterized by higher Ca(2+) efficiency and improved synchronization of vesicular release. The molecular players involved in this transition are still unknown. Here we addressed the involvement of synaptotagmins and otoferlin as putative Ca(2+) sensors in IHC exocytosis during postnatal maturation of the cochlea. Using cell capacitance measurements, we showed that Ca(2+)-evoked exocytosis in mouse IHCs switches from an otoferlin-independent to an otoferlin-dependent mechanism at postnatal day 4. During this early exocytotic period, several synaptotagmins (Syts), including Syt1, Syt2 and Syt7, were detected in IHCs. The exocytotic response as well as the release of the readily releasable vesicle pool (RRP) was, however, unchanged in newborn mutant mice lacking Syt1, Syt2 or Syt7 (Syt1(-/-), Syt2(-/-) and Syt7(-/-) mice). We only found a defect in RRP recovery in Syt1(-/-) mice which was apparent as a strongly reduced response to repetitive stimulations. In post-hearing Syt2(-/-) and Syt7(-/-) mutant mice, IHC synaptic exocytosis was unaffected. The transient expression of Syt1 and Syt2, which were no longer detected in IHCs after the onset of hearing, indicates that these two most common Ca(2+)-sensors in CNS synapses are not involved in mature IHCs. We suggest that otoferlin underlies highly efficient Ca(2+)-dependent membrane-membrane fusion, a process likely essential to increase the probability and synchrony of vesicle fusion events at the mature IHC ribbon synapse.


Figures

Figure 1.
Figure 1.
Ca2+-evoked exocytosis in IHCs during early postnatal development: an otoferlin-independent process before P4. A, B, Examples of ICa and corresponding ΔCm responses in P1 and P6 control and Otof−/− IHCs. Cells were stimulated by a 100 ms voltage step from a holding potential of −80 mV to −10 mV. C, D, ΔCm response average (C) and corresponding ICa density (D) from IHCs at different postnatal stages. E, Otoferlin (red) and CTBP2 (green) immunolabelings in IHCs from P0 and P7 mice. Note the increase in otoferlin immunoreactivity at P7. F, Ca2+ efficiency (ΔCm/ICa) of exocytosis as a function of development for the cells tested in C and D.
Figure 2.
Figure 2.
Properties of otoferlin-independent exocytosis in immature IHCs. A, ICa–voltage relationship and corresponding ΔCm in IHCs from control (triangles) and Otof−/− (circles) P1 mice. B, Corresponding synaptic transfer function plot (ΔCm against ICa amplitude, up to ICa peak). Lines are power function fits with N = 1.6 and N = 1.8 in control (dashed line) and Otof−/− (solid line) IHCs. C, Synaptic transfer function for IHCs from P7 control mice (power fit: N = 1.6), plotted on log scales. D, Kinetics of vesicle pool depletion in P1 IHCs. ΔCm is plotted as a function of the stimulus duration for a step to −10 mV, from a holding potential of −80 mV. Solid lines correspond to a single exponential fit of RRP (inset, between 0 and 200 ms) and dashed lines to another single exponential fit of SRP (500–3000 ms). Fit parameters were for RRP, τ = 48 and 63 ms, ΔCm(max) = 20.8 fF and 16.2 fF, and for SRP, τ = 1363 and 1739 ms, ΔCm(max) = 167 fF and 138 fF in control (black) and Otof−/− (red) IHCs, respectively. E, Kinetics of exocytosis in the presence of 5 mm EGTA in P1 IHCs. Note the block of SRP in the presence of EGTA. Fit values were as follows: τ = 77 ms, ΔCm(max) = 13 fF (control) and τ = 45.5 ms, ΔCm(max) = 11 fF (Otof−/−). F, Absence of fast exocytosis in IHCs from Otof−/− P7 mice, while residual slow vesicular release was still observed. Fit values for IHCs from control mice τ = 29 ms, ΔCm(max) = 56 fF for RRP, and τ = 1000 ms, ΔCm(max) = 526 fF for SRP. Black and red lines are fits for IHCs from control and Otof−/− mice, respectively.
Figure 3.
Figure 3.
Syts expression in cochlear hair cells. Confocal microscopy images of whole mounts of the organ of Corti at P1, P6, P8, and P15, double-labeled either for Syt1 and synaptophysin (Syphy) (A, F), or for Syt1 and Syt2 (B–E). DAPI staining (blue) was used to stain cell nuclei. Dashed lines outline IHCs and OHCs (based on the reconstructed z-stack, data not shown). A–D, Left and right panels are cross-section views in the x,z and y,z plans, respectively. At P1 and P6, a Syt1 staining can be seen along the membrane of IHCs (arrows in A and B, top) and in the terminals of efferent fibers stained for Syphy (A, middle, arrowheads). The merge image (A, bottom) shows an overlapping of Syt1 and Syphy stainings at the efferent fibers below IHCs (arrowheads). No Syphy labeling was seen in IHCs. Syt2 labeling is predominantly cytoplasmic (B, C, middle), compared with that of Syt1, which is mainly located along the basolateral membrane of the cell (B, C, top). At P8, a Syt1 staining is still present in IHCs and OHCs (D, top), while Syt2 is no longer detected in these cells (D, middle panels). E, F, At P15, neither Syt2 nor Syt1 are detected in IHCs and OHCs (E, left and middle). Both proteins are, however, still present in the efferent fibers stained for Syphy (F, middle). Scale bars, 5 μm. G, Single cell RT-PCR was performed in IHCs harvested at P1 and P7. Only IHCs expressing the proper control transcripts (positive for myosin VIIA, and negative for prestin) were computed in the histograms. Data were expressed as a percentage of positive samples [(number of samples containing the Syt transcript/total number of samples tested)*100)]. Asterisks indicate IHCs with significant positive levels of Syt transcripts (χ2 test, p < 0.05). Transcripts for Syts 1, 2, 6, 7 and Syts 1, 6, 7 were the most abundant Syt transcripts in P1 (n = 13) and P7 (n = 13) IHCs, respectively. Note the drastic decrease in Syt2 mRNA expression at P7.
Figure 4.
Figure 4.
Ca2+-dependent exocytosis in IHCs from Syt1−/− newborn mice. A, The organ of Corti of Syt1−/− P0 mice has a normal arrangement of hair cells (green, anti myosin-VIIA labeling) and afferent nerve fibers (red, neurofilament labeling). Scale bar, 10 μm. B, Example of ICa with its corresponding ΔCm response in an IHC from a Syt1−/− P0 mouse. C, Histograms showing the mean ICa peak amplitude and its corresponding ΔCm for Syt1−/− and Syt1+/+ IHCs (100 ms voltage step to −10 mV). D, Average ΔCm plotted against ICa elicited by 100 ms voltage steps ranging from −60 to −10 mV (in 5 mV increments). Lines correspond to a power function fit with N = 2.0 and 2.1 in Syt1+/+ (dashed line) and Syt1−/− (solid line) IHCs, respectively. E, Kinetics of Ca2+-dependent exocytosis. ΔCm is plotted against stimulus duration at a constant voltage (−10 mV). Lines are single exponential fits for Syt1−/− (solid line) and Syt1+/+ (dashed line) IHCs. F–H, Recruitment of vesicles from the fast synaptic vesicular pool. ICa and corresponding ΔCm elicited by a train of 25 successive 50 ms voltage steps to −10 mV, separated by 100 ms time intervals. F, Examples are shown for the first four steps. G, Average cumulative ΔCm responses obtained for 25 consecutive voltage steps. H, Plot of individual ΔCm measured after each voltage step.
Figure 5.
Figure 5.
Ca2+-evoked exocytosis in IHCs from P2–P3 Syt2−/− mice. A, Examples of Ca2+-evoked exocytosis in P2–P3 Syt2+/+ and Syt2−/− IHCs. Cells were stimulated by a 100 ms voltage step to −10 mV from a holding potential of −90 mV. B, Bar graph of average and individual ICa peak amplitudes and their corresponding ΔCm values for Syt2+/+ (n = 17) and Syt2−/− (n = 10) IHCs. C, Kinetics of Ca2+-dependent exocytosis. Only cells with large ΔCm responses were included for the analysis in this graph. D, Average cumulative ΔCm responses from P2–P3 Syt2+/+ and Syt2−/− IHCs elicited using 50 ms repetitive voltage steps to −10 mV (interstep intervals of 100 ms).
Figure 6.
Figure 6.
Ca2+-evoked exocytosis in IHCs from P15–P17 Syt2−/− mice. A, Examples of Ca2+-evoked exocytosis in P15–P17 Syt2+/+ and Syt2−/− IHCs. Cells were stimulated by a 100 ms voltage step from a holding potential of −90 to −10 mV. B, Bar graph of average and individual ICa peak amplitudes and their corresponding ΔCm values, for Syt2+/+ (n = 8) and Syt2−/− (n = 15) IHCs. C, Kinetics of Ca2+-dependent exocytosis. ΔCm is plotted against stimulus duration for pulses to −10 mV. Note that the Syt2+/+ and Syt2−/− data points are overlaid in inset. D, Average cumulative ΔCm responses from P15–P17 Syt2+/+ and Syt2−/− IHCs elicited by 50 ms repetitive voltage steps to −10 mV (interstep interval of 100 ms). E, Left, ΔCm and ICa peak amplitude for an IHC from a P16 Syt2−/− mouse, plotted for different voltages following a 100 ms voltage step from a holding potential of −90 mV. Gray points indicate voltages beyond the ICa peak which were not taken into account to calculate the ΔCm-ICa slope. Middle, Corresponding ΔCm versus ICa plot. The logarithmized data were fitted by a line, giving a slope of 0.89. Right, Average and individual slope values for P15–P17 Syt2+/+ (n = 7) and Syt2−/− (n = 6) IHCs.
Figure 7.
Figure 7.
Comparative Ca2+ thresholds triggering exocytosis in IHCs during postnatal development. A, Comparative IHC synaptic transfer functions (ΔCm vs ICa) plotted on a double log scale, for P1-Otof+/− (open triangle), P1-Otof−/− (black circle) (data from Fig. 2B), P0-Syt1−/− (gray circle; data from Fig. 4D), P7-Otof+/− (green triangle), adult (P15–P30) Syt7+/+(open square) and adult (P16–P30) Syt7−/− (blue square) IHCs. The ICa thresholds necessary to evoke significant ΔCm (>5 fF) were extrapolated by fitting (line) the slope of the initial Cm increase. B, Synaptic vesicular release in adult IHCs has a higher Ca2+ sensitivity (4- to 5-fold) than in P0–P1 and P7 IHCs. This increase in Ca2+ sensitivity in mature IHCs is most likely not due to otoferlin on its own, since P7 IHCs, which still have low Ca2+ sensitivity of exocytosis, already require otoferlin for synaptic vesicular release.

Comment in

References

    1. Achanzar WE, Ward S. A nematode gene required for sperm vesicle fusion. J Cell Sci. 1997;110:1073–1081. - PubMed
    1. Bansal D, Campbell KP. Dysferlin and the plasma membrane repair in muscular dystrophy. Trends Cell Biol. 2004;14:206–213. - PubMed
    1. Bansal D, Miyake K, Vogel SS, Groh S, Chen CC, Williamson R, McNeil PL, Campbell KP. Defective membrane repair in dysferlin-deficient muscular dystrophy. Nature. 2003;423:168–172. - PubMed
    1. Beurg M, Safieddine S, Roux I, Bouleau Y, Petit C, Dulon D. Calcium- and otoferlin-dependent exocytosis by immature outer hair cells. J Neurosci. 2008;28:1798–1803. - PMC - PubMed
    1. Beutner D, Moser T. The presynaptic function of mouse cochlear inner hair cells during development of hearing. J Neurosci. 2001;21:4593–4599. - PMC - PubMed

Publication types

MeSH terms

LinkOut - more resources