. 2010 Oct 6;30(40):13431-40.
doi: 10.1523/JNEUROSCI.1144-10.2010.

Spatiotemporal coupling between hippocampal acetylcholine release and theta oscillations in vivo

Affiliations

Spatiotemporal coupling between hippocampal acetylcholine release and theta oscillations in vivo

Hao Zhang et al. J Neurosci. .

Abstract

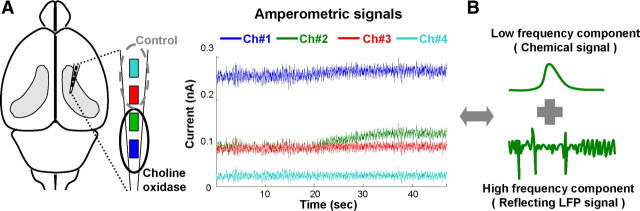
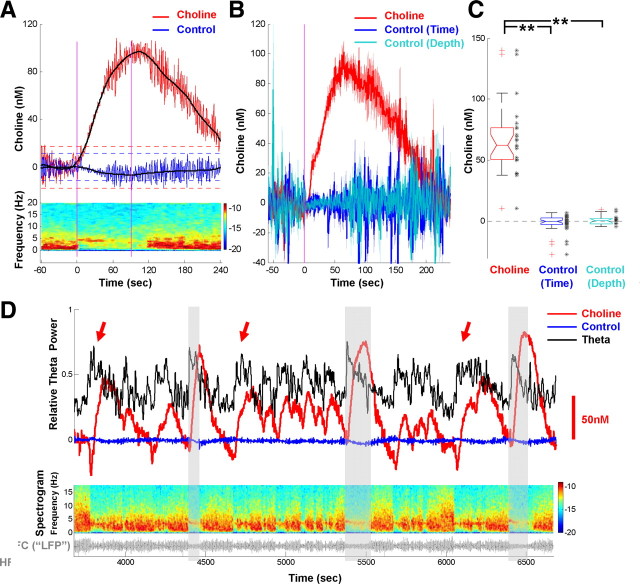
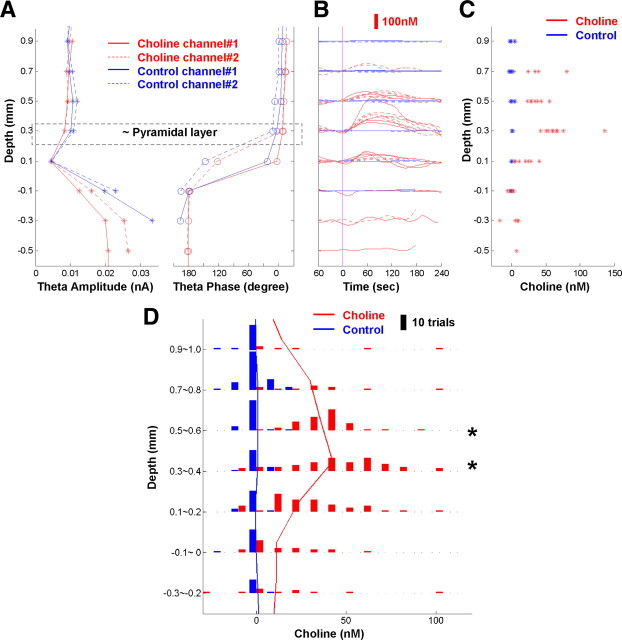
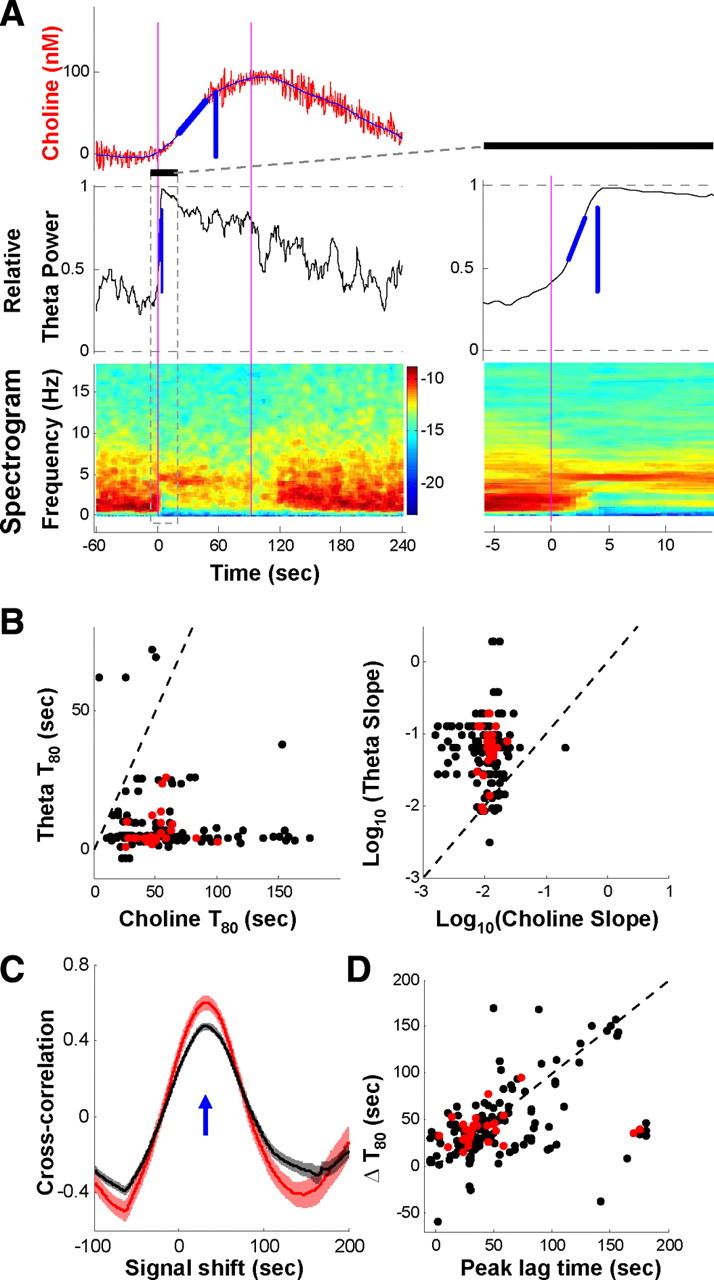
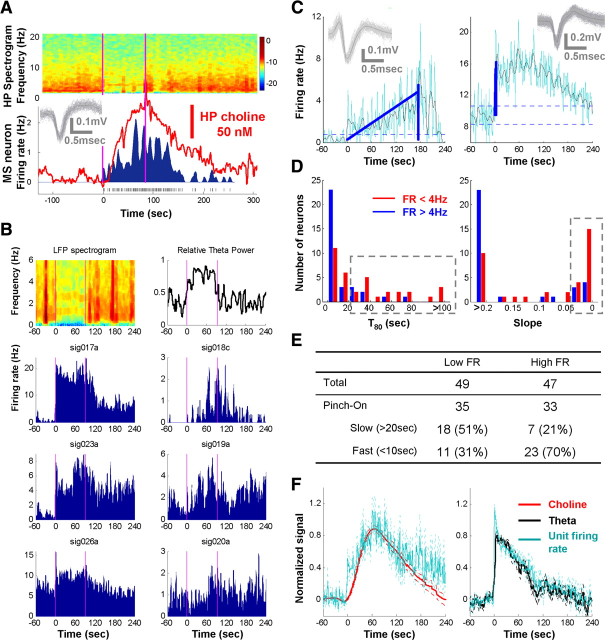
Both acetylcholine (ACh) and theta oscillations are important for learning and memory, but the dynamic interaction between these two processes remains unclear. Recent advances in amperometry techniques have revealed phasic ACh releases in vivo. However, it is unknown whether phasic ACh release co-occurs with theta oscillations. We investigated this issue in the CA1 region of urethane-anesthetized male rats using amperometric and electrophysiological recordings. We found that ACh release was highly correlated with the appearance of both spontaneous and induced theta oscillations. Moreover, the maximal ACh release was observed around or slightly above the pyramidal layer. Interestingly, such release lagged behind theta initiation by 25-60 s. The slow ACh release profile was matched by the slow firing rate increase of a subset of medial-septal low-firing-rate neurons. Together, these results establish, for the first time, the in vivo coupling between phasic ACh release and theta oscillations on spatiotemporal scales much finer than previously known. These findings also suggest that phasic ACh is not required for theta initiation and may instead operate synergistically with theta oscillations to promote neural plasticity in the service of learning and memory.


Figures

Figure 1.
Figure 1.
Simultaneous recording of choline fluctuation and theta oscillations with amperometry. A, Schematics and example of amperometry recording with a four-channel choline sensor in the hippocampus. In this example, channel 1 (Ch#1; blue) and channel 2 (Ch#2; green) were coated with choline oxidase, whereas channel 3 (Ch#3; red) and channel 4 (Ch# 4; cyan) were control channels. Channel assignment for enzyme coating was reversed in half of the sensors. B, Amperometric signal from an individual channel can be separated into low- and high-frequency components, reflecting chemical and LFP signals, respectively (Zhang et al., 2009).
Figure 2.
Figure 2.
Phasic choline increase coupled to theta oscillations. A, An example of phasic choline increase coupled to theta oscillations induced by tail pinch (between pink lines). Red and blue traces, Choline and control signals; black lines, local fit of the two signals. Horizontal dotted lines indicate ±3 × SD of baseline fluctuations. The pseudocolor spectrogram (bottom) shows theta oscillations caused by pinch. B, Phasic choline increases averaged from 10 rats, each from the depth that showed maximal choline increase in an individual rat (more details about depth distribution in Fig. 3). For all trials included (29 trials total), choline increase exceeded its baseline fluctuation (3 × SD). Pink line, Pinch start; solid lines and shading, average ± SEM; Control (Time), signals on control channels in the same pinch trials but at other depths; Control (Depth), signals on control channels at the same depth that showed choline increase but in other trials in the same experiment. C, Choline increase quantified (averaged for 120 s after pinch) for all trials in B. Black dots, Values from individual trials; **p < 0.001. D, Choline increases accompanying spontaneous as well as pinch-induced theta. Overlaying gray boxes indicate three pinches. Red and blue traces, Choline and control; black trace, theta index calculated from spectrogram; gray trace in the bottom, HFC of amperometric signal. Spectrogram calculated from HFC shows the spontaneous and induced theta. Arrows indicate spontaneous choline/theta with amplitude comparable to pinch-induced ones (opaque gray boxes).
Figure 3.
Figure 3.
Maximal phasic choline increase observed around CA1 pyramidal layer. A–C, Examples of phasic choline increases in one experiment. A, Depth profiles of theta amplitude and phase for HFC on all four channels. Depth 0, Phase fuly reversed; horizontal box, putative pyramidal layer. B, Choline and control signals induced by pinch. Pink line, Pinch start. C, Choline increase quantifications (120 s average) at different depths, with maximal observed at +0.3 mm. D, Summary of depth distribution of choline increase from 10 rats. Histograms show varying choline increase distributions at different depths. Maximal choline increase appeared around 0.3–0.6 mm above phase reversal. Red and blue lines indicate median values at each depth, with a peak at 0.3–0.4 mm for choline. *p < 0.05, compared with distributions at other depths; increases at 0.3–0.4 mm were marginally larger than those at 0.5–0.6 mm; p = 0.08, two tailed.
Figure 4.
Figure 4.
Phasic choline increase often lags theta initiation. A, An example of slower choline increase compared to concomitant theta oscillations. Vertical blue lines indicate the time at which the choline signal or theta index reached 80% of its maximal value (T80, or rise time). Oblique blue lines indicate slopes for the signals to rise from 30 to 70% of maximum. Inset, Magnified view of rapid rise of theta index (indicated by the box and black bar on the left). B, Summary of rise time (left) and slope (right) for simultaneous pair of choline signal and theta index. Each pair (one point) from one trial with significant choline increase; red points from the trials displayed in Figure 2, B and C. Dashed lines indicate unity. Rise time for theta (theta initiation) was usually very short (<5 s), much faster than choline rise (both T80 and slope, p < 0.001). C, Cross-correlation between choline signal and theta index. Red curves, Trials in Figure 2, B and C; black curves, all trials with choline increase; solid lines and shading, average ± SEM. The blue arrow indicates the lag time with the maximal correlation (30–70 s, theta leading). D, Summary of correlation lag time and rise time difference (ΔT80) for all trials in B. The dashed line indicates unity.
Figure 5.
Figure 5.
A subpopulation of low-firing-rate MSvDB neurons has slow firing rate increase matching the slow choline increase. A, Firing rate change of a single MSvDB neuron matching simultaneously recorded choline signal, both rising slowly, whereas theta initiation was much faster (spectrogram on top). Pink lines, Pinch start/end; raster in bottom, neuronal spikes. Inset, Raw spike waveforms. B, Six MSvDB neurons (single units) recorded simultaneously during one pinch trial. Pink lines, Start and end of the pinch. Three neurons on the left had a high average firing rate (>4 Hz) and increased their firing rates rapidly after pinch, whereas the three low-firing-rate MSvDB neurons (right) increased their firing over tens of seconds. C, Example of two simultaneously recorded neurons with rise time (T80, vertical blue line) and slope (0–70% maximal, oblique blue line) calculated. Time 0, Pinch start, cyan and black traces, 2 s smoothed and local-fit firing rates; horizontal dotted lines, 3 × SD of baseline fluctuation. Insets, Raw spike waveforms. D, Summary for all neurons (single units) with significant increase in firing during pinch-induced theta episode, grouped according to their average firing rates (>4 or <4 Hz). Most high-frequency neurons have rapid rise, matching the rapid theta initiation. In contrast, a substantial proportion of low-firing-rate neurons (gray rectangles; 51%) increase their firing much slower, consistent with the relative slow increase of choline signals in Figure 4. E, Summary table of the number of neurons in different categories. Columns show categories defined by firing rate (FR). Pinch-on neurons are further separated into slow-increase (T80 > 20 s) and fast-increase (T80 < 10 s) categories, and the percentages are shown in parentheses. F, Pooled signals show matching dynamics. Each signal (choline, theta index, and unit firing rate) from individual trials was baseline removed and normalized to its maximum. Solid and dotted lines, Average ± SEM. Choline/theta signals and unit recordings were obtained from separate experiments. Left, Firing rate changes of low-firing-rate, slow-increase (T80 > 20 s) neurons (n = 18) matched the slow increase of choline signals (n = 29 trials in Fig. 2, B and C). Right, Firing rate changes of high-firing-rate, fast-increase (T80 < 10 s) neurons (n = 23) matched the fast theta dynamics (n = 29 trials in Fig. 2, B and C). Normalized unit firing rate signals were scaled to match choline and theta signals (left, 3; right, 1.4).

Comment in

References

    1. Adams RN. In vivo electrochemical measurements in the CNS. Prog Neurobiol. 1990;35:297–311. - PubMed
    1. Andersen P, Morris R, Amaral D, Bliss T, O'Keefe J, editors. Oxford: Oxford UP; 1996. The hippocampus book.
    1. Apartis E, Poindessous-Jazat FR, Lamour YA, Bassant MH. Loss of rhythmically bursting neurons in rat medial septum following selective lesion of septohippocampal cholinergic system. J Neurophysiol. 1998;79:1633–1642. - PubMed
    1. Arvidsson U, Riedl M, Elde R, Meister B. Vesicular acetylcholine transporter (VAChT) protein: a novel and unique marker for cholinergic neurons in the central and peripheral nervous systems. J Comp Neurol. 1997;378:454–467. - PubMed
    1. Bakin JS, Weinberger NM. Induction of a physiological memory in the cerebral cortex by stimulation of the nucleus basalis. Proc Natl Acad Sci U S A. 1996;93:11219–11224. - PMC - PubMed

Publication types

MeSH terms

LinkOut - more resources