. 2010 Oct 6;30(40):13537-48.
doi: 10.1523/JNEUROSCI.3457-10.2010.

NMDA-mediated regulation of DSCAM dendritic local translation is lost in a mouse model of Down's syndrome

Affiliations

NMDA-mediated regulation of DSCAM dendritic local translation is lost in a mouse model of Down's syndrome

Alexandra Alves-Sampaio et al. J Neurosci. .

Abstract

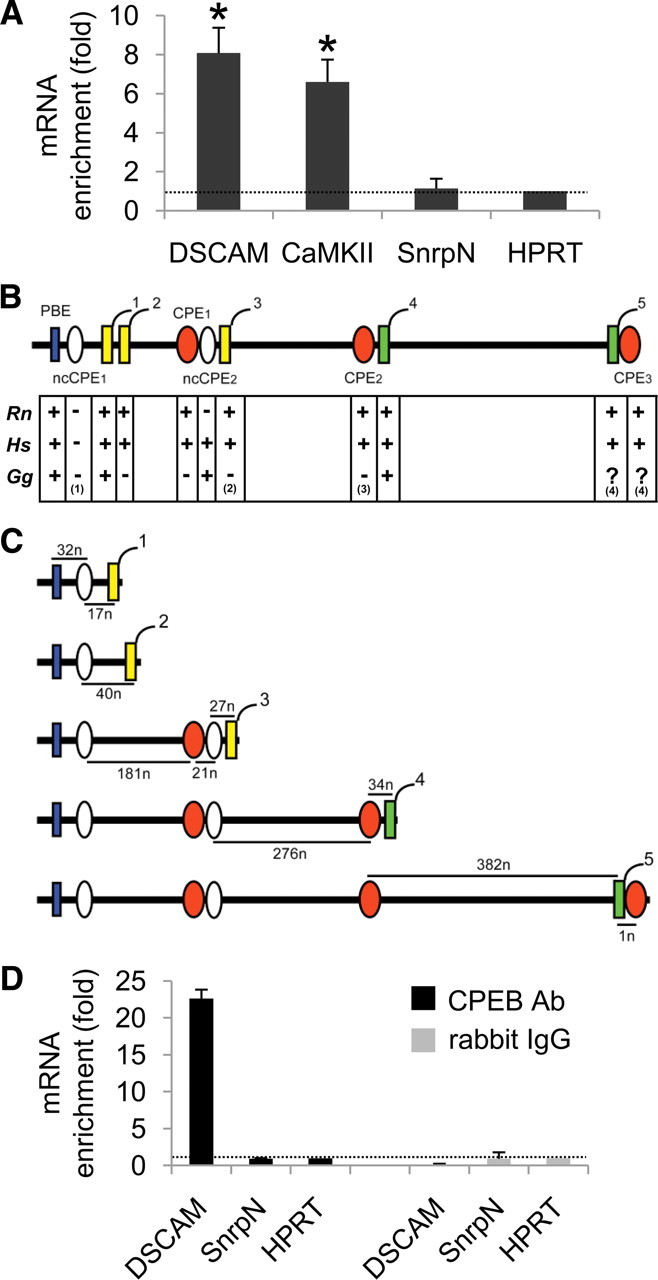
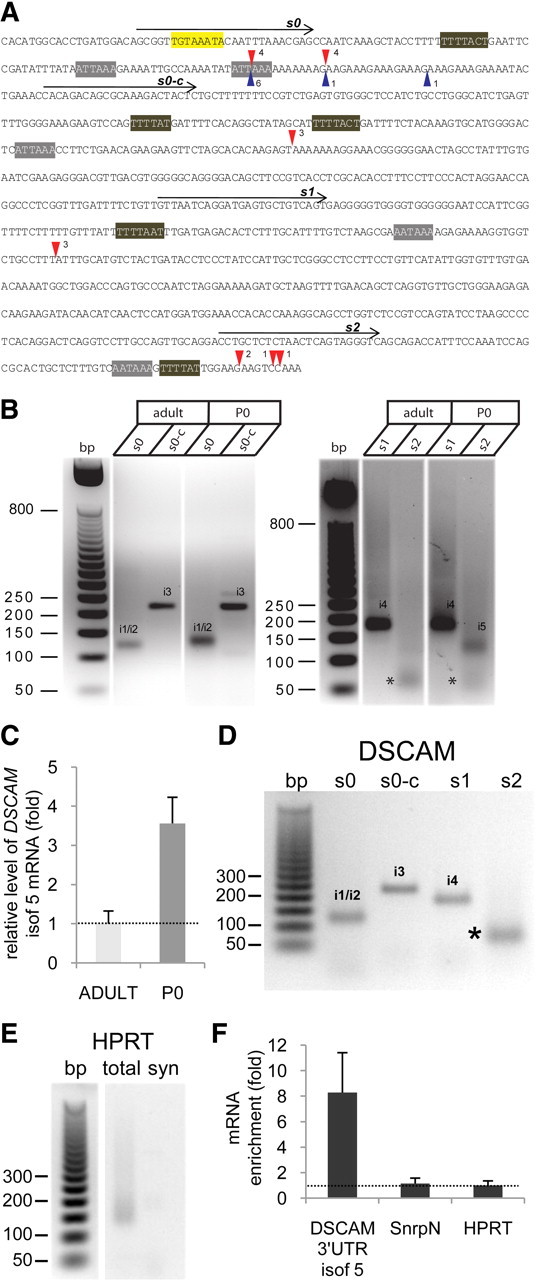
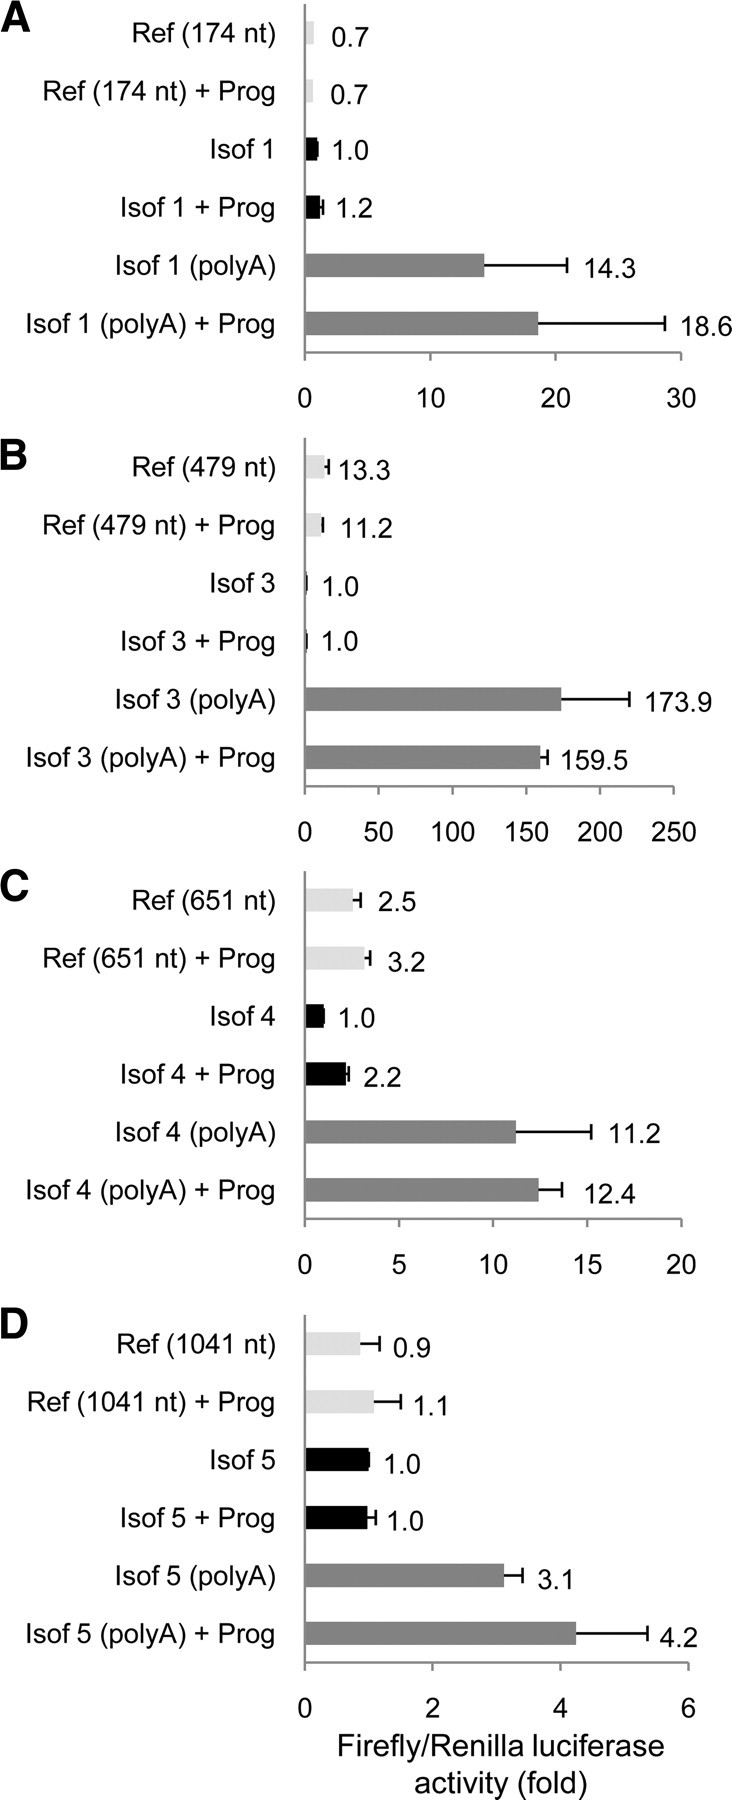
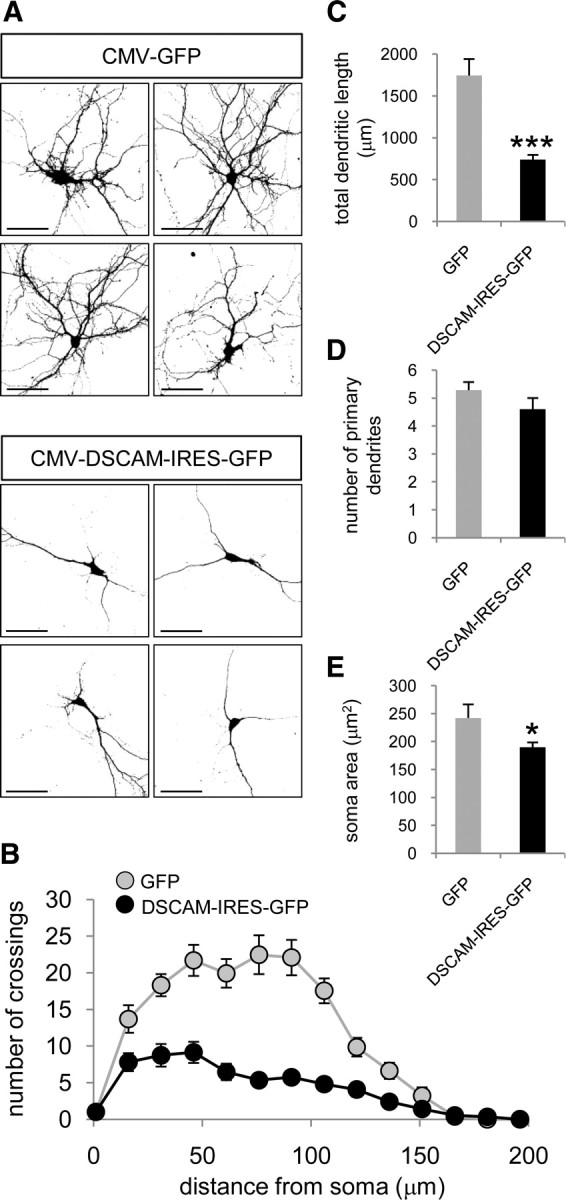
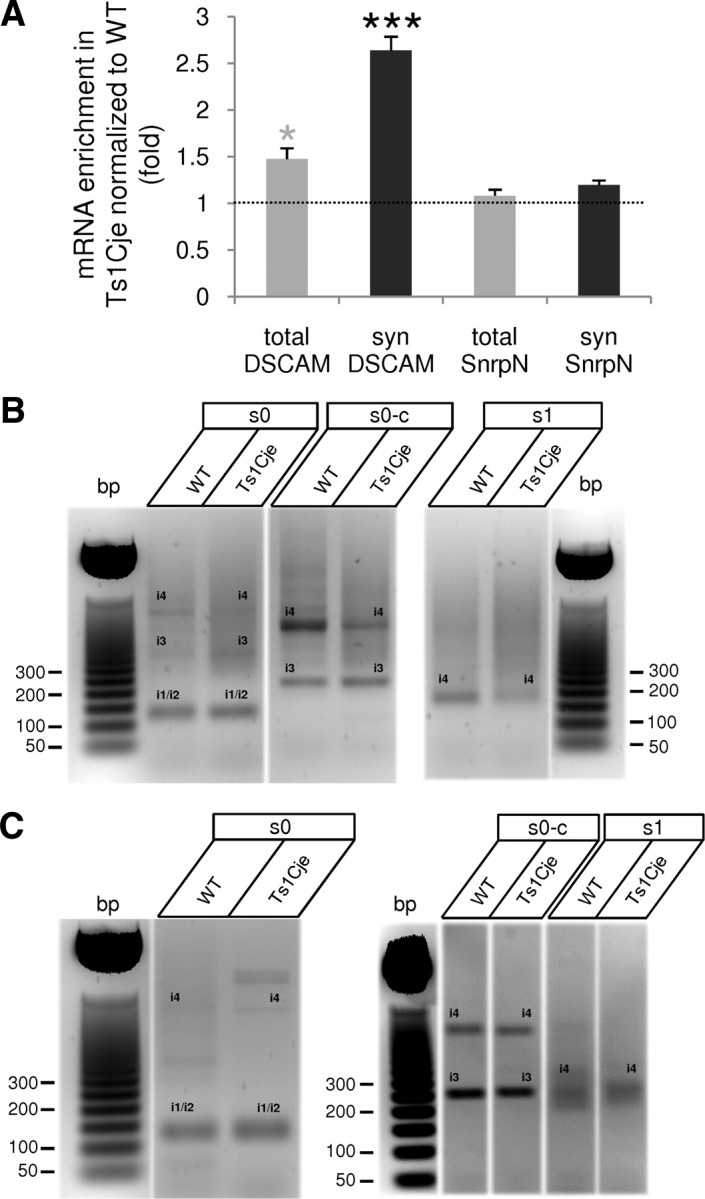
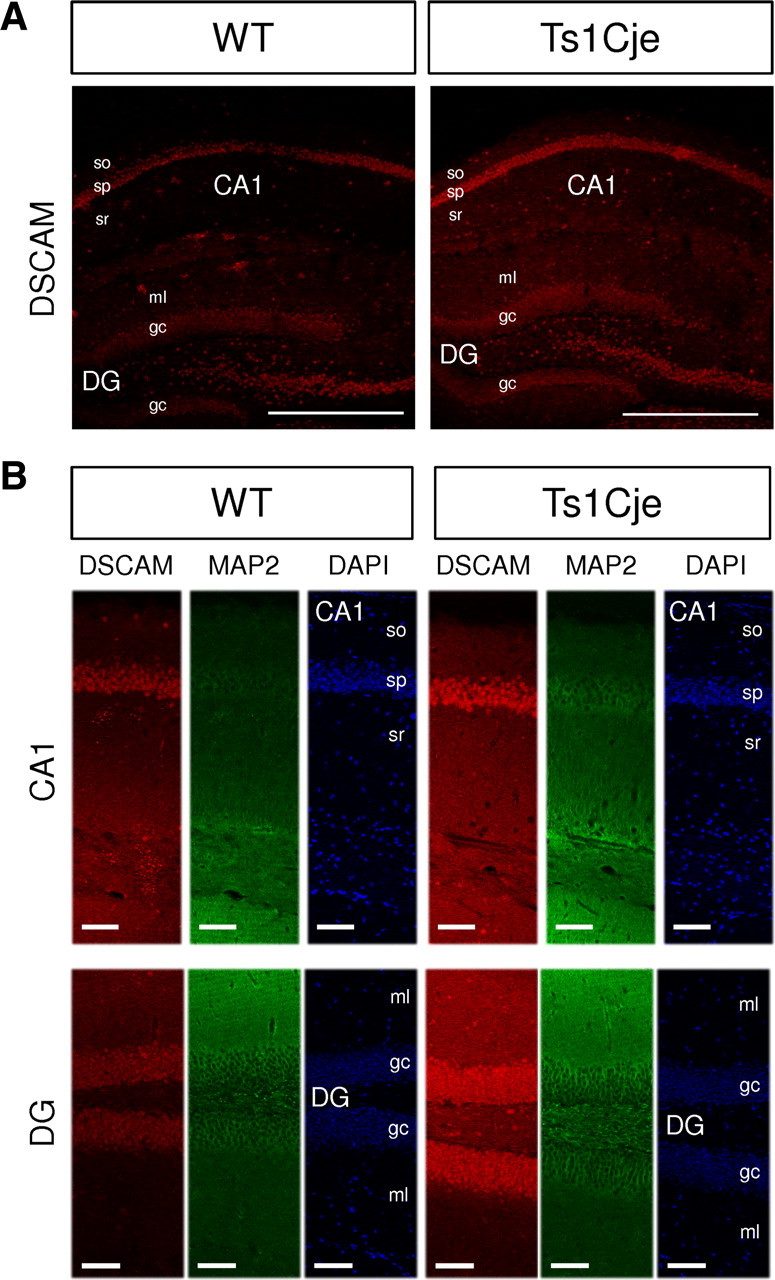
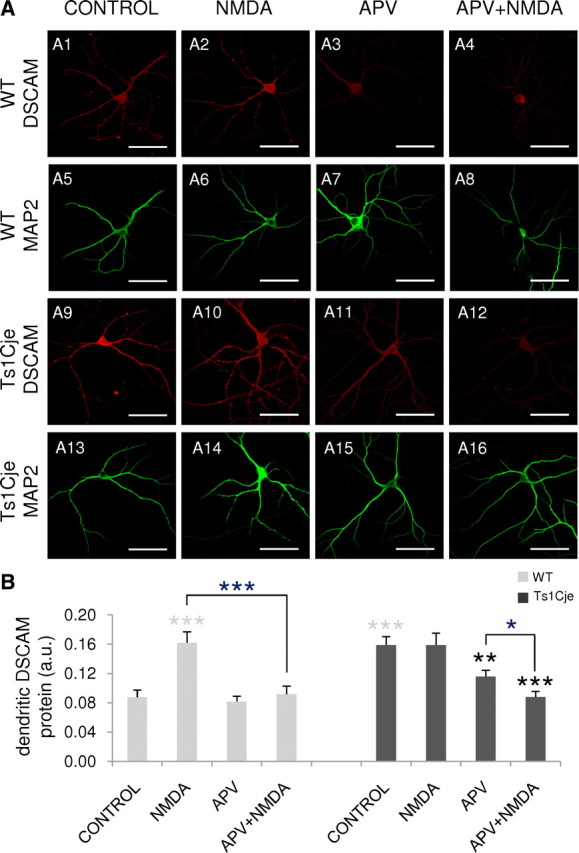
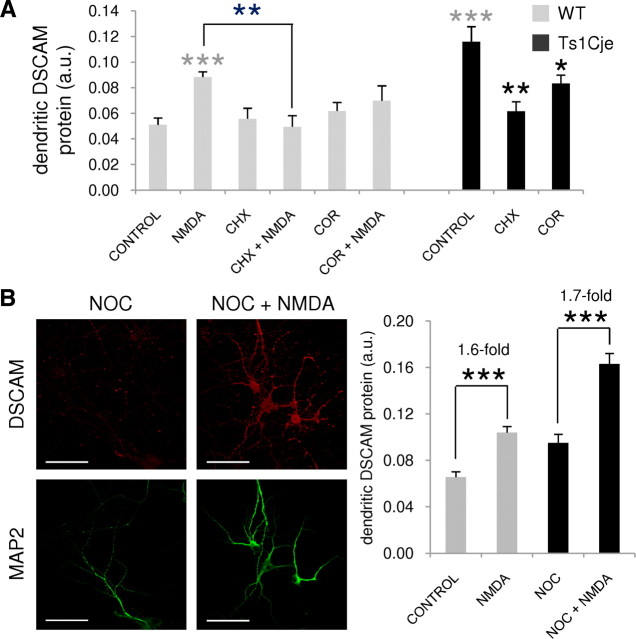
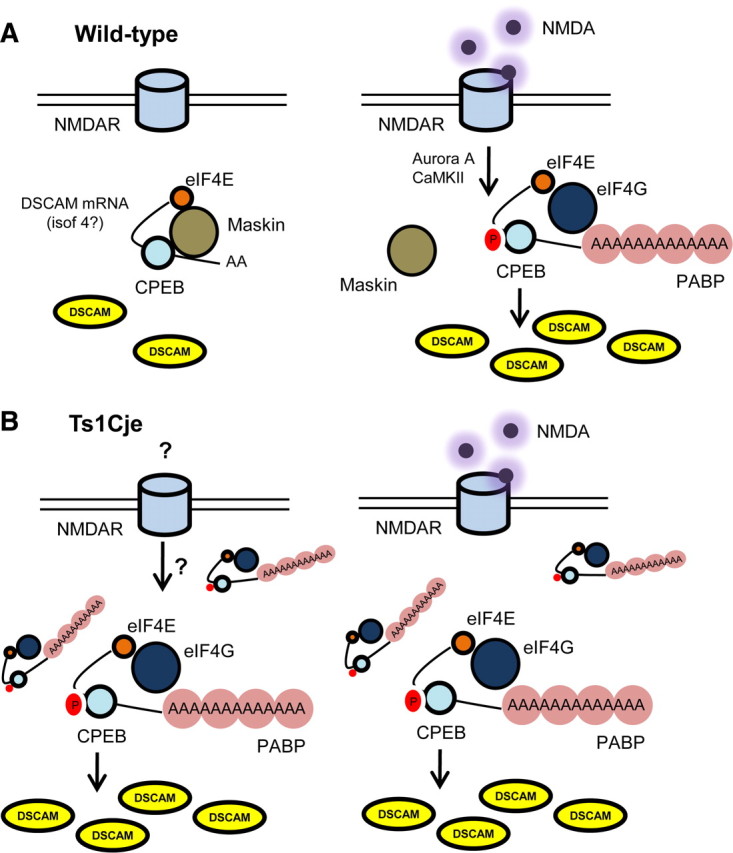
Down's syndrome cell adhesion molecule (DSCAM) belongs to the Down's syndrome critical region of human chromosome 21, and it encodes a cell adhesion molecule involved in dendrite morphology and neuronal wiring. Although the function of DSCAM in the adult brain is unknown, its expression pattern suggests a role in synaptic plasticity. Local mRNA translation is a key process in axonal growth, dendritogenesis, and synaptogenesis during development, and in synaptic plasticity in adulthood. Here, we report the dendritic localization of DSCAM mRNA in the adult mouse hippocampus, where it associates with CPEB1 [cytoplasmic polyadenylation element (CPE) binding protein 1], an important regulator of mRNA transport and local translation. We identified five DSCAM isoforms produced by alternative polyadenylation bearing different combinations of regulatory CPE motifs. Overexpression of DSCAM in hippocampal neurons inhibited dendritic branching. Interestingly, dendritic levels of DSCAM mRNA and protein were increased in hippocampal neurons from Ts1Cje mice, a model of Down's syndrome. Most importantly, DSCAM dendritic translation was rapidly induced by NMDA in wild-type, but not in Ts1Cje neurons. We propose that impairment of the NMDA-mediated regulation of DSCAM translation may contribute to the alterations in dendritic morphology and/or synaptic plasticity in Down's syndrome.


Figures

Figure 1.
Figure 1.
Dendritic localization of DSCAM mRNA and its association to the CPEB1 protein in the mouse hippocampus. A, DSCAM, α-CaMKII, and SnrpN mRNAs were quantified by real-time RT-PCR in synaptoneurosomes and in total extracts from the mouse hippocampus, and normalized to the levels of HPRT mRNA in the corresponding sample. The enrichment in synaptoneurosomes versus total extract is shown as the mean from four to five independent experiments (2–3 independent RT-PCR determinations per experiment). The error bars indicate SEM. Statistically significant differences when compared with HPRT are indicated as follows: *p < 0.05. B, Regulatory motifs found in the most 3′ exon of the mouse DSCAM gene are shown, including a Pumilio-binding element (PBE) (in blue), nonconsensus and consensus cytoplasmic polyadenylation elements (ncCPEs and CPEs) (in white and orange, respectively), and alternative polyadenylation hexamers (numbered from 1 to 5; AUUAAA sequence in yellow; AAUAAA sequence in green). Conservation of regulatory motifs in Rattus norvegicus (Rn), Homo sapiens (Hs), and Gallus gallus (Gg) is also shown. Notes: (1) In G. gallus, ncCPE1 is a consensus CPE (UUUUAUU sequence); (2) an additional poly(A) signal (AUUAAA) is present 33 nt downstream; (3) an additional consensus CPE [(U)15AAUUA sequence] is present 122 nt upstream the polyA4 signal; (4) sequence not available. C, Theoretical DSCAM 3′-UTR isoforms produced in mouse by alternative usage of polyadenylation hexamers 1–5. The distances between the pairs of regulatory motifs are indicated in nucleotides (n). D, Levels of DSCAM and SnrpN mRNAs in CPEB1–mRNA and rabbit IgG–mRNA (negative control) complexes immunoprecipitated from the mouse hippocampus. The mRNA enrichment in the corresponding complex compared with the mRNA levels in the extract from which they were immunoprecipitated, is shown as the mean of two independent RT-PCR determinations. The error bars indicate the SEM, and the values were normalized to HPRT expression.
Figure 2.
Figure 2.
Functionality of alternative DSCAM polyadenylation signals in the mouse hippocampus. A, DSCAM 3′-UTR sequence showing the position of the oligonucleotides s0, s0-c, s1, and s2, used to identify the functional polyadenylation signals by RL-PAT. The red triangles show the cleavage positions for the corresponding polyadenylation hexamers, as deduced from sequencing of RL-PAT products; the number of sequenced clones supporting the corresponding cleavage site is also indicated. The blue triangles show the cleavage sites identified when using synaptoneurosomal RNA in the s0 RL-PAT assay. The PBE sequence (in yellow), CPE motifs (in brown), and poly(A) sites (in gray) are also marked. B, RL-PAT assay on the adult and neonatal (P0) mouse hippocampus. The estimated sizes of the PCR products were ∼120 bp (s0 primer), 220 bp (s0-c primer), 180 bp (s1 primer), and 130 bp (s2 primer). The bands marked with asterisks were identified as primer-dimer artifacts after cloning and sequencing; i1/i2, isoforms 1/2; i3, isoform 3; i4, isoform 4; i5, isoform 5. C, The mRNA levels of DSCAM isoform 5 in total extracts of the adult and neonatal (P0) mouse hippocampus were quantified by real-time RT-PCR, and normalized to the HPRT mRNA in the corresponding sample. The error bars indicate the SEM from two independent RT-PCR determinations in a representative experiment. D, RL-PAT for hippocampal synaptoneurosomes using DSCAM oligos s0, s0-c, s1, and s2 produced PCR products of a similar size to those shown in B. The band marked with an asterisk corresponded to the primer-dimer PCR artifact. E, RL-PAT for total or synaptoneurosomal (syn) hippocampal RNA using a HPRT specific oligo. F, Levels of DSCAM isoform 5 (isof 5) and of the SnrpN mRNAs quantified by real-time RT-PCR in synaptoneurosomes and in total extracts from mouse hippocampus, and normalized to HPRT mRNA in the corresponding sample. Enrichment in synaptoneurosomes versus total extract is shown for a representative experiment, in which the error bars indicate the SEM from two independent RT-PCR determinations.
Figure 3.
Figure 3.
Translational regulation of DSCAM isoforms in Xenopus oocytes. Oocytes were injected with a normalizing Renilla luciferase mRNA and a synthetic firefly luciferase transcript containing the 3′-UTR of the DSCAM isoforms 1 (A), 3 (B), 4 (C), or 5 (D). For each isoform, control transcripts with an unrelated 3′-UTR [reference (Ref)] of the indicated length (in nucleotides) or the same 3′-UTR followed by a poly(A) tail of 73 nt [poly(A)] were also tested. The oocytes were incubated with or without or progesterone (Prog) and in each condition, the Renilla-normalized firefly luciferase activity is shown in arbitrary units. The mean of two independent experiments (n = 25 injected oocytes per condition) is indicated next to the corresponding error bar (SEM).
Figure 4.
Figure 4.
Decreased dendritic complexity in DSCAM-overexpressing hippocampal neurons. A, Representative micrographs of hippocampal neurons transfected at DIV7 with the indicated constructs. Neuronal morphology was visualized by GFP immunocytochemistry 2 d after transfection. Dendrites were identified as MAP2-positive neurites. Scale bars, 60 μm. B, Sholl analysis of the neurons transfected with GFP or DSCAM-IRES-GFP vectors. C, Total dendritic length of neurons transfected with the indicated constructs. D, Number of primary dendrites of neurons transfected with the indicated constructs. E, Somatic area of neurons transfected with the indicated plasmids. Mean values are shown (12–15 neurons); the error bars indicate the SEM, and asterisks denote statistically significant differences: *p < 0.05, ***p < 0.001.
Figure 5.
Figure 5.
Increased dendritic level of DSCAM mRNA in the hippocampus of Ts1Cje mice. A, Increased levels of DSCAM mRNA in Ts1Cje total hippocampal extract (total) and synaptoneurosomes (syn), when compared with their wild-type (WT) littermates. The soma-restricted SnrpN mRNA was used as a control. The mRNA levels, determined by quantitative real-time RT-PCR, were normalized to HPRT mRNA, and the means from three to four independent experiments (2 independent RT-PCR determinations per experiment) are shown. The error bars indicate the SEM, and the gray and black asterisks denote statistically significant differences with respect to total SnrpN and synaptoneurosomal SnrpN values, respectively: *p < 0.05, ***p < 0.001. B, RL-PAT assay on total hippocampal RNA with oligos s0, s0-c, and s1 showing a similar pattern of DSCAM isoforms in Ts1Cje and wild-type (WT) mice. Note that, in this particular experiment, s0 oligo amplified isoforms 3 and 4 (i3 and i4, identified after cloning and sequencing) in addition to isoforms 1/2 (i1/i2); similarly, i4 was also visible when using oligo s0-c (identified by sequencing). C, RL-PAT with oligos s0, s0-c, and s1 showing a pattern of DSCAM isoform similar in wild-type (WT) and Ts1Cje hippocampal synaptoneurosomes. In this particular experiment, isoform 4 (i4) was also visible when using oligos s0 and s0-c.
Figure 6.
Figure 6.
Increased dendritic level of DSCAM protein in the hippocampus of Ts1Cje mice. A, Immunohistochemical detection of DSCAM protein showing an increase in the Ts1Cje adult hippocampus compared with the wild type (WT). A confocal section is shown. Scale bars, 500 μm. so, Stratum oriens; sp, stratum pyramidale; sr, stratum radiatum; DG, dentate gyrus; ml, molecular layer; gc, granule cell layer. B, Comparison of DSCAM signal in dendritic (MAP2-positive) and somatic (DAPI-labeled) layers of wild-type (WT) and Ts1Cje hippocampus. Signal intensities were higher in dendritic layers of CA1 and DG, as well as in pyramidal cell layer (sp, stratum pyramidale) and granule cells (gc) of Ts1Cje hippocampus. A maximal projection of four consecutive confocal sections taken at equivalent locations at the hippocampus is shown in each case. Scale bars, 80 μm. A and B correspond to different experiments.
Figure 7.
Figure 7.
Regulation of the dendritic expression of DSCAM by NMDA. A, DSCAM immunocytochemistry with DIV12 hippocampal neurons from wild-type (WT) and Ts1Cje littermates untreated (CONTROL) and exposed to 50 μm NMDA (NMDA) or 120 μm APV (APV) for 10 min, or preincubated with 120 μm APV for 10 min before the addition of 50 μm NMDA for 10 min (APV+NMDA). The dendrites are labeled by MAP2 immunofluorescence. Scale bars, 60 μm. B, Relative DSCAM protein levels in dendrites of neurons treated as described in A [arbitrary units (a.u.)]. The mean pixel intensity for DSCAM immunofluorescence in dendrites was quantified in 12–20 images from two independent experiments. Error bars indicate the SEM. The statistically significant differences with respect to the wild-type and Ts1Cje controls are indicated with gray and black asterisks, respectively: *p < 0.05, **p < 0.01, ***p < 0.001.
Figure 8.
Figure 8.
Effect of cycloheximide, cordycepin, and nocodazole on NMDA regulation of the dendritic levels of DSCAM. A, DIV12 hippocampal neurons from wild-type (WT) or Ts1Cje littermates receiving no treatment (CONTROL), 50 μm NMDA (NMDA), 1 μm cycloheximide (CHX), or 80 μm cordycepin (COR) for 10 min, or preincubated with cycloheximide or cordycepin for 10 min before addition of 50 μm NMDA for an additional 10 min period (CHX+NMDA and COR+NMDA, respectively), as indicated. Mean pixel intensity of dendritic DSCAM labeling after immunocytochemistry was quantified in six to eight images, and is shown in arbitrary units (a.u.). Error bars indicate the SEM. Statistically significant differences with respect to wild-type and Ts1Cje controls are indicated with gray and black asterisks, respectively: *p < 0.05, **p < 0.01, ***p < 0.001. B, DSCAM and MAP2 immunocytochemistry with DIV10 hippocampal neurons preincubated with 1 μg/ml nocodazole (NOC) during 6 h before addition or not of 50 μm NMDA for an additional 10 min period, as indicated. Scale bars, 60 μm. Note the punctuated MAP2 immunolabeling, probably reflecting the effect of nocodazole on the microtubule network. Mean pixel intensity of dendritic DSCAM labeling after immunocytochemistry was quantified in 20 images and is shown in arbitrary units (a.u.). Error bars indicate the SEM. Statistically significant differences are indicated with asterisks: ***p < 0.001. Note that, in this experiment, values between nontreated and nocodazole-treated neurons are not comparable, because nocodazole solution contained DMSO as vehicle.
Figure 9.
Figure 9.
Hypothetical model describing the local NMDA-regulated dendritic translation of DSCAM in wild type and Ts1Cje mice. A, In wild-type hippocampal neurons, synaptic activity mediated by NMDA activates kinases (Aurora A or CaMKII) capable of phosphorylating CPEB1 protein. CPEB1 phosphorylation disrupts the inhibitory Maskin–eIF4E interaction, promoting polyadenylation of DSCAM mRNA. PABP associates to DSCAM poly(A) tail and interacts with eIF4G, stabilizing the eIF4E–eIF4G interaction, which is essential for the initiation of translation. B, In trisomic hippocampal neurons, dendritic DSCAM mRNA levels and translation are constitutively increased, regardless of the presence of NMDA. However, DSCAM translation requires both NMDA receptor activity and polyadenylation as it is blocked by APV and cordycepin. Thus, Ts1Cje neurons are unable to modulate DSCAM translation in response to NMDAR-mediated synaptic activity. This impairment may contribute to DS neuropathology.

References

    1. Agarwala KL, Nakamura S, Tsutsumi Y, Yamakawa K. Down syndrome cell adhesion molecule DSCAM mediates homophilic intercellular adhesion. Brain Res Mol Brain Res. 2000;79:118–126. - PubMed
    1. Agarwala KL, Ganesh S, Suzuki T, Akagi T, Kaneko K, Amano K, Tsutsumi Y, Yamaguchi K, Hashikawa T, Yamakawa K. Dscam is associated with axonal and dendritic features of neuronal cells. J Neurosci Res. 2001;66:337–346. - PubMed
    1. Alarcon JM, Hodgman R, Theis M, Huang YS, Kandel ER, Richter JD. Selective modulation of some forms of Schaffer collateral-CA1 synaptic plasticity in mice with a disruption of the CPEB-1 gene. Learn Mem. 2004;11:318–327. - PMC - PubMed
    1. Antonarakis SE, Lyle R, Dermitzakis ET, Reymond A, Deutsch S. Chromosome 21 and down syndrome: from genomics to pathophysiology. Nat Rev Genet. 2004;5:725–738. - PubMed
    1. Arribas J, Borroto A. Protein ectodomain shedding. Chem Rev. 2002;102:4627–4638. - PubMed

Publication types

MeSH terms