. 2010 Dec;21(23):4108-19.
doi: 10.1091/mbc.E10-07-0580. Epub 2010 Oct 6.

β1A integrin is a master regulator of invadosome organization and function

Affiliations

β1A integrin is a master regulator of invadosome organization and function

Olivier Destaing et al. Mol Biol Cell. 2010 Dec.

Abstract

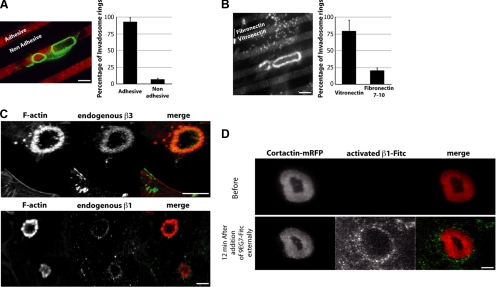
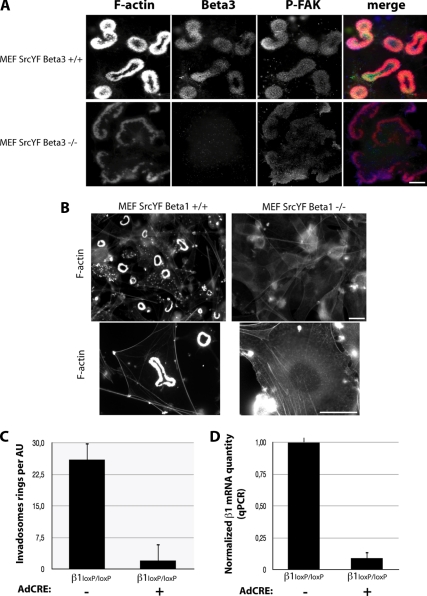
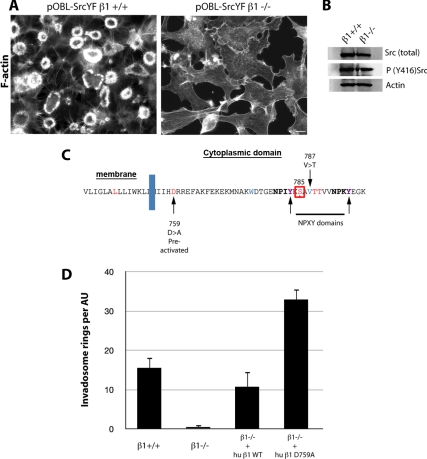
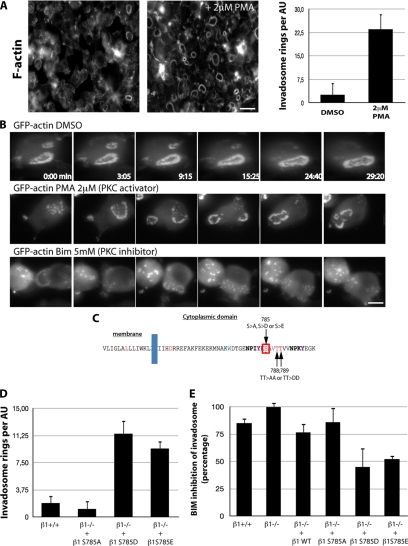
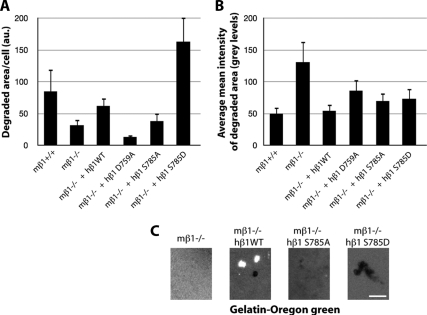
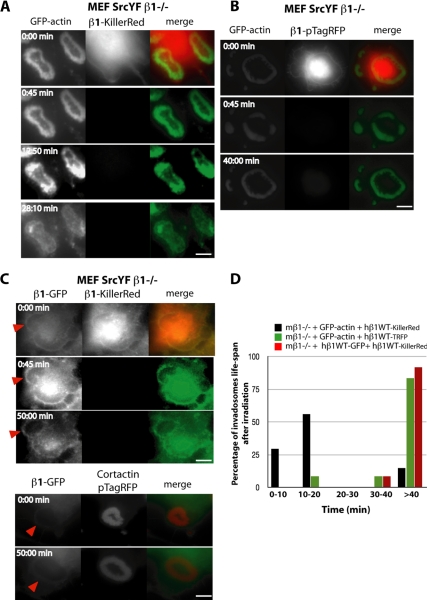
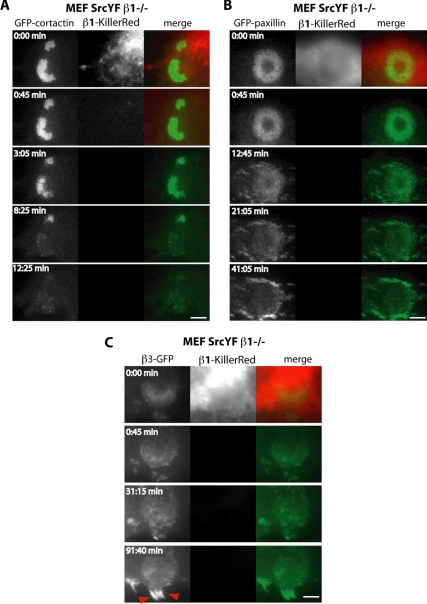
Invadosomes are adhesion structures involved in tissue invasion that are characterized by an intense actin polymerization-depolymerization associated with β1 and β3 integrins and coupled to extracellular matrix (ECM) degradation activity. We induced the formation of invadosomes by expressing the constitutive active form of Src, SrcYF, in different cell types. Use of ECM surfaces micropatterned at the subcellular scale clearly showed that in mesenchymal cells, integrin signaling controls invadosome activity. Using β1⁻/⁻ or β3⁻/⁻ cells, it seemed that β1A but not β3 integrins are essential for initiation of invadosome formation. Protein kinase C activity was shown to regulate autoassembly of invadosomes into a ring-like metastructure (rosette), probably by phosphorylation of Ser785 on the β1A tail. Moreover, our study clearly showed that β1A links actin dynamics and ECM degradation in invadosomes. Finally, a new strategy based on fusion of the photosensitizer KillerRed to the β1A cytoplasmic domain allowed specific and immediate loss of function of β1A, resulting in disorganization and disassembly of invadosomes and formation of focal adhesions.


Figures

Figure 1.
Figure 1.
Extracellular matrix sensing by β1 and β3 integrins controls invadosome formation and localization. (A) Most SrcYF-expressing cells formed invadosome rosettes (visualized by F-actin staining, in green) only on the adhesive surface (gelatin-tetramethylrhodamine B isothiocyanate [TRITC], in red, mixed with vitronectin) and not on antiadhesive areas (Pluronic F127, black areas). (B) Invadosome rosettes stained by phalloidin-TRITC show higher affinity for vitronectin-FITC (light gray bands), sensed by members of the β3 integrin family, than for fibronectin (black bands), sensed by members of both the β1 and β3 integrin families. (C) The β1 and β3 integrins show distinct patterns of localization, observed in MEF-SrcYF cells. β3 (in green in merge) highly colocalized with F-actin, whereas β1 staining is limited to the rosette periphery. (D) 9EG7 antibody β1 staining is specific of the activated form of the integrin. Antibody against activated form of β1 directly conjugated to FITC (9EG7-FITC) was added externally and localized around the invadosome visualized by cortactin-mRFP (in red in merge) expressed in live MEF-SrcYF cells. Bars, 5 μm (A and B), 4 μm (C), and 2 μm (D).
Figure 2.
Figure 2.
β1A, and not β3, integrin is essential for invadosome formation. (A) β3 is not essential for invadosome formation and self-assembly into rosettes, visualized by F-actin (in red in merge) and phospho-Y397-FAK (in blue in merge) staining, which occurs in both MEF-SrcYF β3 +/+ or −/− cells. (B) In contrast, β1 depletion in MEF-SrcYF β1LoxP/LoxP expressing the CRE recombinase for 96 h resulted in the disappearance of isolated invadosomes or in rosettes probed by phalloidin staining. (C) Quantification of the percentage of cells forming invadosomes reveals that almost 95% of MEF-SrcYF β1LoxP/LoxP treated with CRE recombinase did not form this structure 4 d after infection (n = 650 counted cells/condition). (D) Quantification by qPCR shows an average decrease of 95% in the level of β1 mRNA 96 h post-CRE treatment. Bars, 3 μm (A) and 10 μm (B).
Figure 3.
Figure 3.
Activation of β1 stimulates invadosome autoassembly. (A) β1 depletion in pOBL-SrcYF induced the disappearance of invadosomes, shown by phalloidin staining of F-actin. Bar, 5 μm. (B) β1 depletion does not affect Src activation. Lysates of pOBL-SrcYF β1+/+ and −/− cells were probed by Western blotting for phospho-SrcY416, a marker of Src activation, total Src, and actin. (C) Amino-acyl sequence of the cytoplasmic domain of β1A integrin and the location of the main mutation that activates this integrin. (D) Expression of the preactivated mutants of β1 (β1 D759A) in pOBL-SrcYF β1−/− cells dramatically increases the number of invadosome rosettes per airy unit, whereas β1WT mutant rescue the rosette number up to the control level.
Figure 4.
Figure 4.
PKC regulates invadosome autoassembly by phosphorylating Ser785 of β1A integrins. (A) PKC activation by a 60-min treatment of pOBL-SrcYF cells with 2 μM PMA induces a massive increase in invadosome rosette autoassembly, visualized by phalloidin staining. (B) Extracted images from time series (in minutes) from representative observations of pOBL-SrcYF cells expressing GFP-actin and treated with either dimethyl sulfoxide (DMSO; control), the PKC activator PMA (2 μM), and the PKC inhibitor BIM (5 mM). PKC activity regulates the dynamics and maintenance of the invadosome autoassembly state. (C) Amino-acyl sequence of the cytoplasmic domain of β1A integrin and the location of the main PKC targets. (D) Quantification of invadosomes per Airy unit (AU) shows that a mutation mimicking a constitutive phosphorylated form of Ser785 (Asp or Glu) dramatically increases the formation of rosettes in pOBL-SrcYF β1−/− cells. The nonphosphorylatable mutant of β1 at this site (S785A) has no effect on rosette formation. (E) The number of rosettes/AU was quantified in pOBL-SrcYF cells treated with 2 μM PMA or simultaneously with PMA and 5 mM BIM for 60 min. The inhibitory effect of BIM was determined by calculating the percent inhibition of invadosome rosette formation. Mutants mimicking a constitutively phosphorylated Ser785 (S785D and S785E) show only 50% inhibition after BIM treatment, indicating that this residue on β1 is a major target of PKC in the regulation of invadosome autoassembly. Bars, 20 μm (A) and 5 μm (B).
Figure 5.
Figure 5.
β1 activity and signaling control invadosome ECM degradation activity. (A) Quantification of the degraded surface of gelatin-Oregon green per cell reveals that β1 has an essential function in this invadosome function. Surprisingly, expression of the activated mutant of β1 (D759A) induces numerous invadosome rosettes associated with poor degradation activity. Moreover, constitutive activation of the signaling pathway downstream of phosphorylation of Ser785 strongly stimulates ECM degradation. (B) β1 also controls the quality of the degradation, as revealed by quantification of the average intensity of the resorbed areas. The few areas degraded in the pOBL-SrcYF β1−/− cells are poorly digested because they are close to the maximal fluorescence intensity of a nondigested surface (255) in comparison with pOBL-SrcYF β1+/+ cells (values closer to 0 indicate a totally black, completely digested area). Between 600 and 1050 cells were counted per condition. (C) Representative images extracted from the time series of pOBL-SrcYF β1−/− cells expressing or not expressing either human β1 WT, D759A, S785A, or S785D spread on a layer of degradable gelatin-Oregon green. Bar, 10 μm.
Figure 6.
Figure 6.
Photoinactivation revealed role of β1 in maintaining invadosome self-assembly. (A) Representative images extracted from time series of MEF-SrcYF β1−/− cells expressing human β1-KillerRed and GFP-actin. Exogenous human β1-KillerRed is functional in rescuing invadosome formation and its proper localization at the periphery. Exposure of KillerRed to light for 45 s is followed by fluctuations in intensity and disorganization of GFP-actin in the invadosome rosette. (B) Representative images extracted from time series of MEF-SrcYF β1−/− cells expressing human β1-pTagRFP, which has the same excitation and emission spectrum but is much more photostable than KillerRed, and GFP-actin. Light irradiation without ROS production is not sufficient to dissociate invadosomes. (C) Representative images extracted from time series of MEF-SrcYF β1−/− cells expressing human β1-KillerRed and human β1-GFP. These two proteins colocalized, but ROS production at this level of β1-KillerRed has no effect on either β1-GFP stability or on any other important proteins for invadosome integrity because invadosomes are still present when β1-KillerRed is photoinactivated. Moreover, β1-KillerRed depletion did not affect β1-GFP behavior in comparison to β1-GFP present in untreated invadosome visualized by cortactin-pTRFP. (D) Photoinactivation of β1-KillerRed leads to rapid and specific disorganization of invadosomes. Histograms, show the distribution of the percentage of cells where invadosomes are disorganized at various times after light irradiation. The x-axis shows time in minutes. Twelve to 39cells per condition were monitored. Bars, 3 μm (A–C).
Figure 7.
Figure 7.
β1 photoinactivation leads to the loss of cortactin, disorganization of adhesion molecules within the invadosome metastructures, and induction of large, β3-rich focal adhesions. (A) Representative images extracted from time series of MEF-SrcYF β1−/− cells expressing human β1-KillerRed and GFP-cortactin. Photoinactivation of β1-KillerRed is followed by a slow decrease in GFP-cortactin fluorescence and its disappearance. (B) Representative images extracted from time series of MEF-SrcYF β1−/− cells expressing both human β1-KillerRed and GFP-paxillin. β1 photoinactivation leads to GFP-paxillin disorganization and decrease in intensity, but in contrast to what is observed with GFP-cortactin, GFP-paxillin remains associated with the invadosome. (C) Representative images extracted from time series of MEF-SrcYF β1−/− cells expressing human β1-KillerRed and β3-GFP. β1 photoinactivation leads to slow dissociation of invadosomes and the massive formation of β3-rich focal adhesions (red arrows). Bars, 3 μm (A–C).

References

    1. Albiges-Rizo C., Destaing O., Fourcade B., Planus E., Block M. R. Actin machinery and mechanosensitivity in invadopodia, podosomes and focal adhesions. J. Cell Sci. 2009;122:3037–3049. - PMC - PubMed
    1. Artym V. V., Zhang Y., Seillier-Moiseiwitsch F., Yamada K. M., Mueller S. C. Dynamic interactions of cortactin and membrane type 1 matrix metalloproteinase at invadopodia: defining the stages of invadopodia formation and function. Cancer Res. 2006;66:3034–3043. - PubMed
    1. Ayala I., Baldassarre M., Giacchetti G., Caldieri G., Tete S., Luini A., Buccione R. Multiple regulatory inputs converge on cortactin to control invadopodia biogenesis and extracellular matrix degradation. J. Cell Sci. 2008;121:369–378. - PubMed
    1. Badowski C., Pawlak G., Grichine A., Chabadel A., Oddou C., Jurdic P., Pfaff M., Albiges-Rizo C., Block M. R. Paxillin phosphorylation controls invadopodia/podosomes spatiotemporal organization. Mol. Biol. Cell. 2008;19:633–645. - PMC - PubMed
    1. Bellows C. G., Sodek J., Yao K. L., Aubin J. E. Phenotypic differences in subclones and long-term cultures of clonally derived rat bone cell lines. J. Cell. Biochem. 1986;31:153–169. - PubMed

Publication types

MeSH terms