. 2010 Nov 1;185(9):5082-92.
doi: 10.4049/jimmunol.1001821. Epub 2010 Oct 6.

Blockade of programmed death-1 pathway rescues the effector function of tumor-infiltrating T cells and enhances the antitumor efficacy of lentivector immunization

Affiliations

Blockade of programmed death-1 pathway rescues the effector function of tumor-infiltrating T cells and enhances the antitumor efficacy of lentivector immunization

Qifeng Zhou et al. J Immunol. .

Abstract

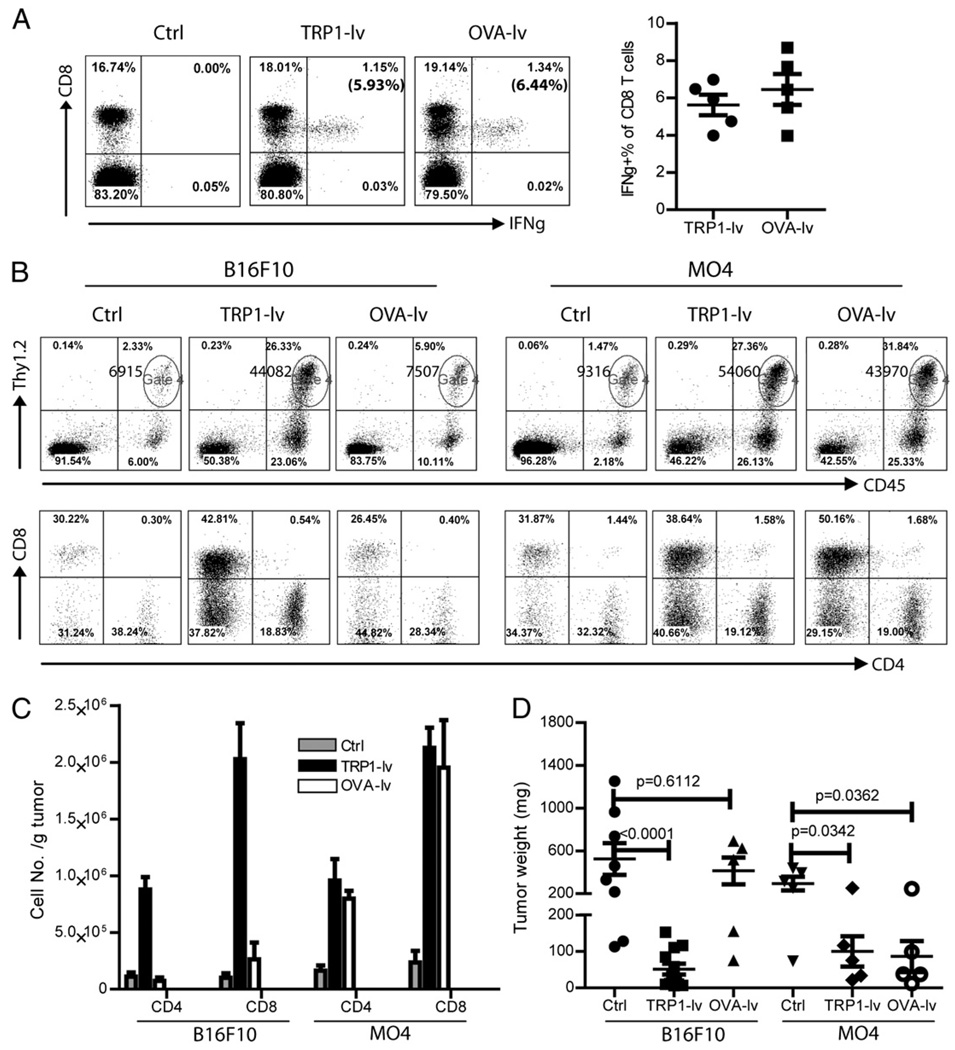
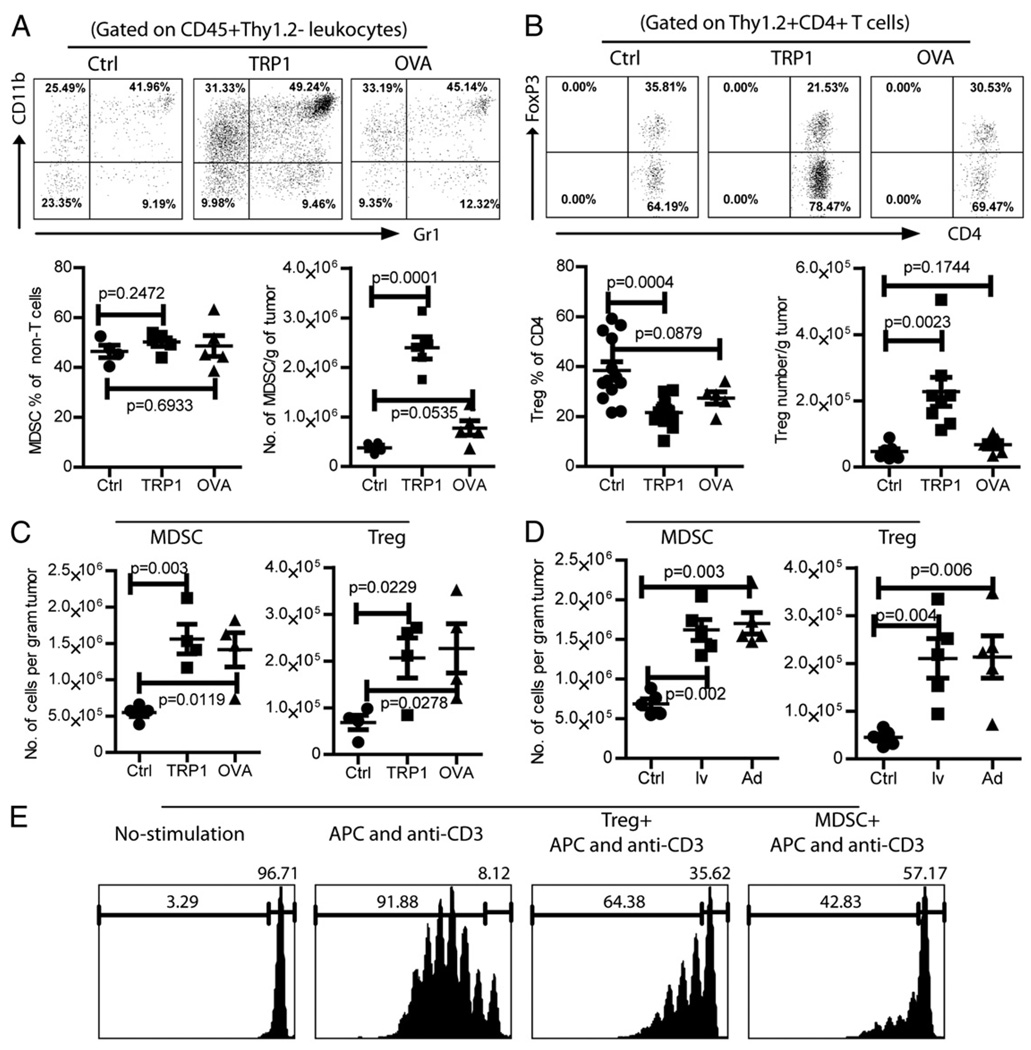
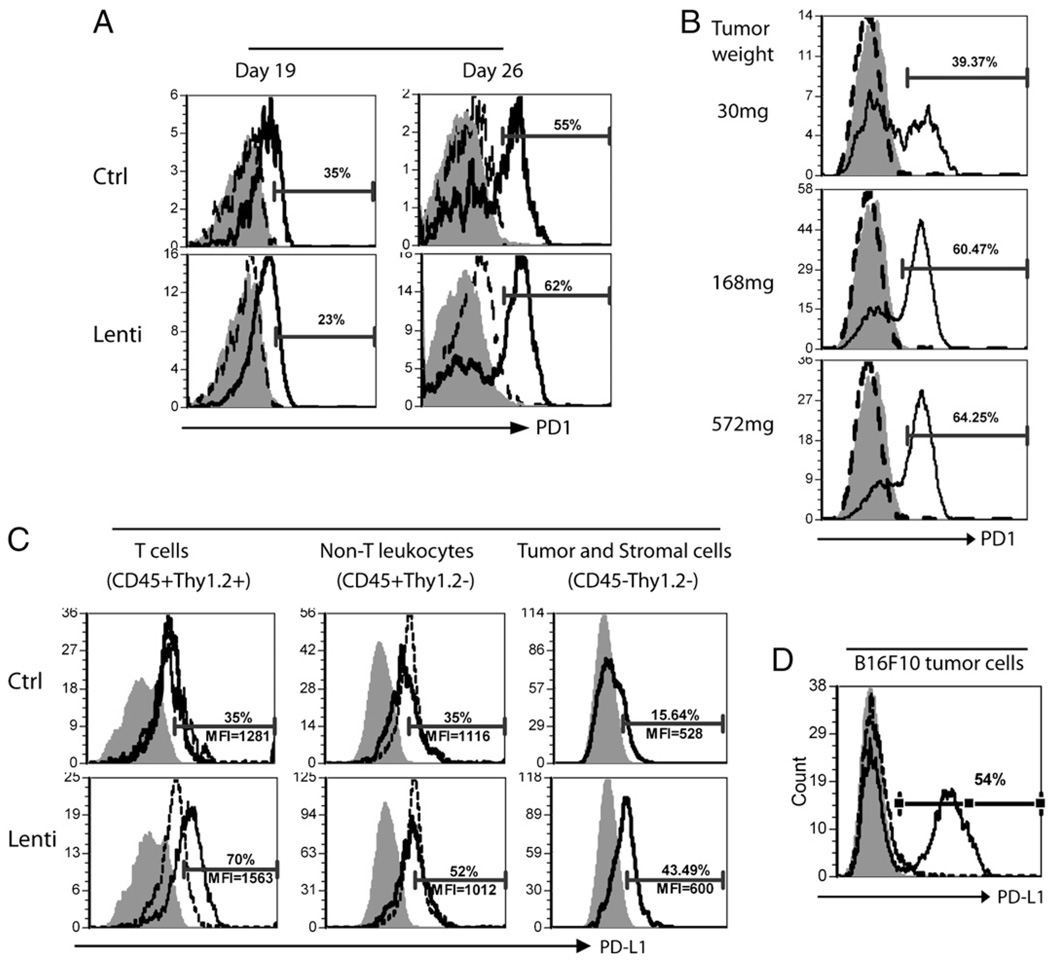
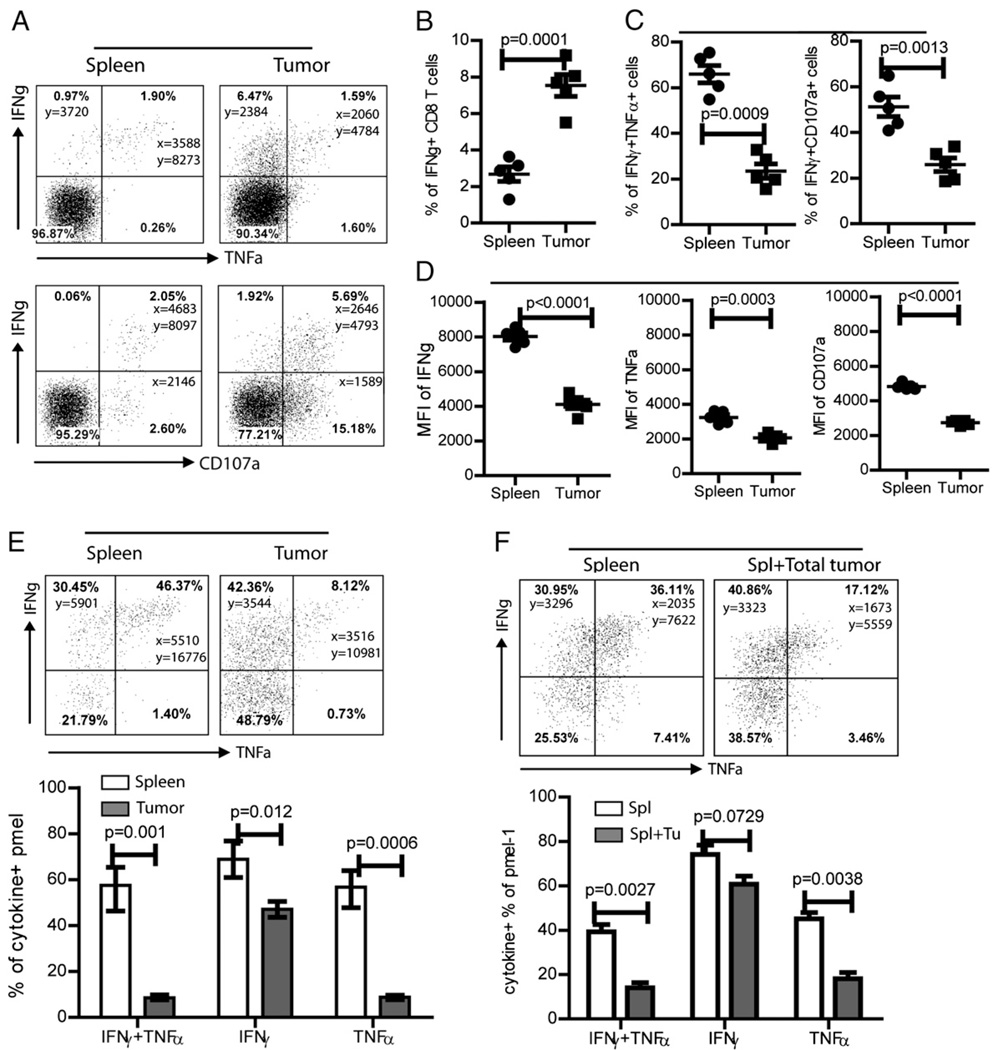
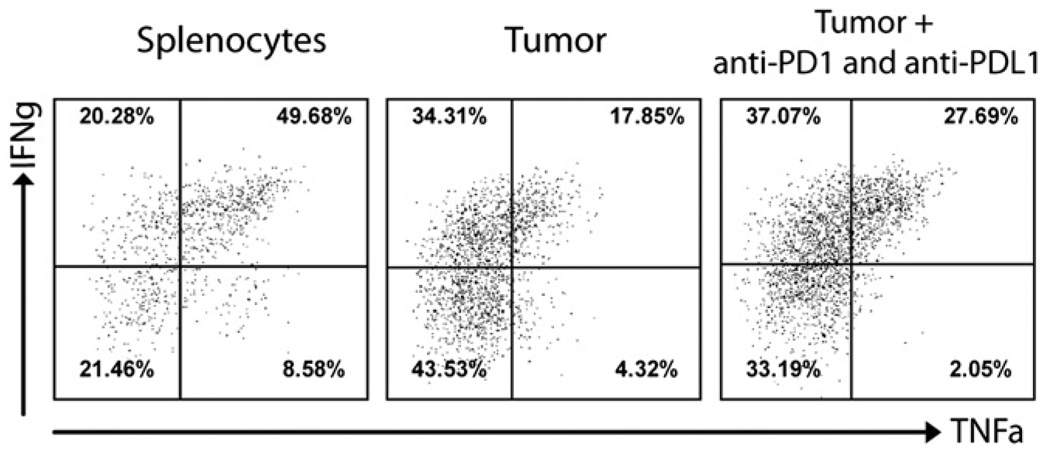
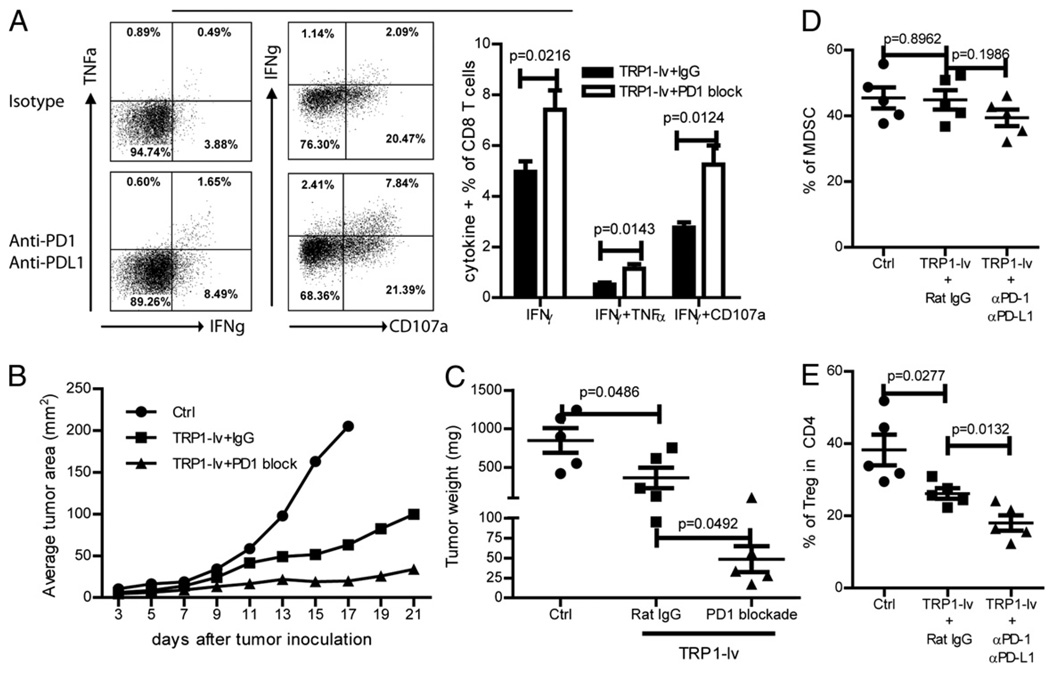
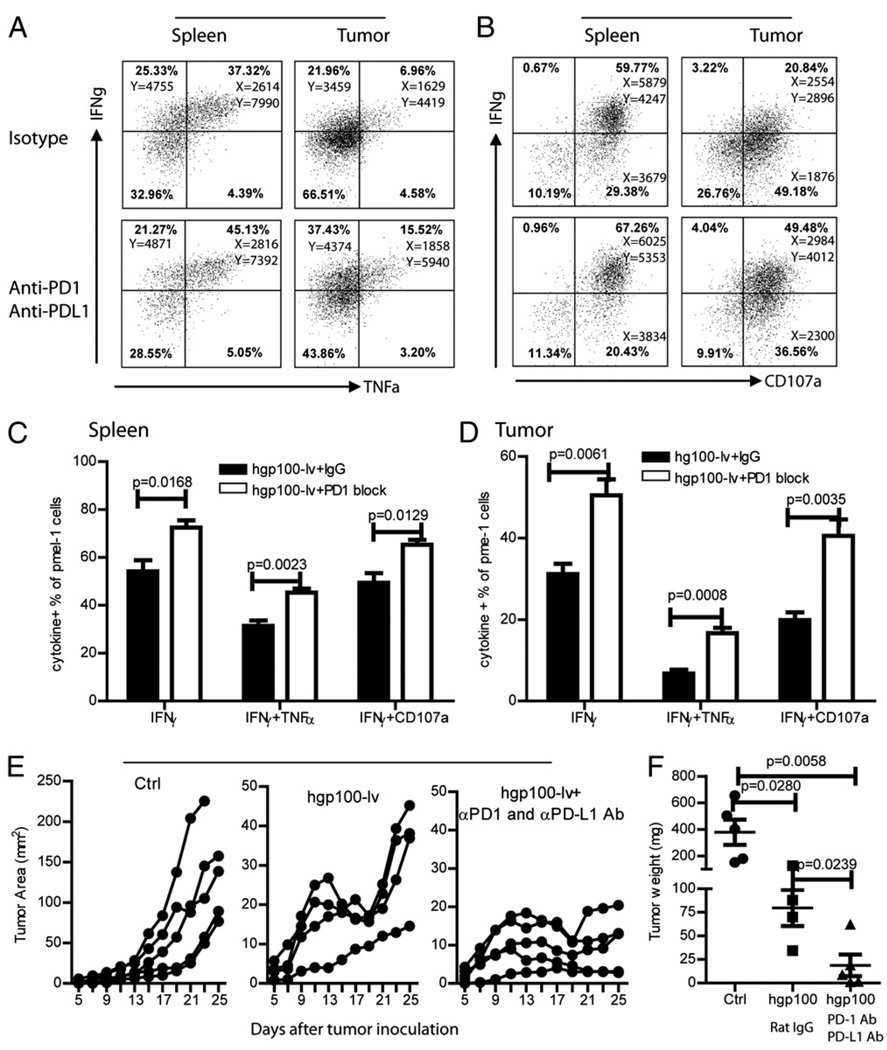
Despite intensive effort, the antitumor efficacy of tumor vaccines remains limited in treating established tumors regardless of the potent systemic tumor-specific immune response and the increases of tumor infiltration of T effector cells. In the current study, we demonstrated that although lentivector (lv) immunization markedly increased Ag-dependent tumor infiltration of CD8 and CD4 T cells and generated Ag-specific antitumor effect, it simultaneously increased the absolute number of myeloid-derived suppressor cells and regulatory T cells in the tumor lesions. In addition, lv immunization induced expression of programmed death-ligand 1 in the tumor lesions. Furthermore, the tumor-infiltrating CD8 T cells expressed high levels of programmed death-1 and were partially dysfunctional, producing lower amounts of effector cytokines and possessing a reduced cytotoxicity. Together, these immune-suppression mechanisms in the tumor microenvironment pose a major obstacle to effective tumor immunotherapy and may explain the limited antitumor efficacy of lv immunization. The loss of effector function in the tumor microenvironment is reversible, and the effector function of CD8 T cells in the tumor could be partially rescued by blocking programmed death-1 and programmed death-ligand 1 pathway in vitro and in vivo, resulting in enhanced antitumor efficacy of lv immunization. These data suggest that immunization alone may exacerbate immune suppression in the tumor lesions and that methods to improve the tumor microenvironment and to rescue the effector functions of tumor-infiltrating T cells should be incorporated into immunization strategies to achieve enhanced antitumor efficacy.


Conflict of interest statement

Disclosures

The authors have no financial conflicts of interest.

Figures

FIGURE 1
FIGURE 1
Lv immunization stimulates Ag-dependent tumor infiltration of CD8 and CD4 T cells. Mice bearing 5-d B16F10 and MO4 tumors were immunized with either TRP1-lv or OVA-lv. A, Systemic immune responses were examined on day 14 after immunization. The numbers in the parentheses in the upper right quadrants indicate the percentage of IFN-γ+ CD8 T cells of total CD8 T cells in the peripheral blood. A summary of the systemic CD8 responses of five mice is presented on the right. B and C, Single-cell suspensions from tumor lesions were stained for CD45, Thy1.2, CD4, and CD8. Alive cells were gated based on the forward and side scatter. A representative plot from each group is presented (B). The numbers in the upper right quadrants of the top panel plots represent the absolute numbers of Thy1.2+ T cells (gate 4). The T cells (CD45+Thy1.2+) were then analyzed for CD8 and CD4 (lower panels of B). The absolute numbers of total CD8 and CD4 T cells were calculated based on the tumor weight used and the cell numbers in each analysis. Data of three experiments are summarized and presented as mean ± SE (C). D, The tumor weight was recorded at the end of the experiment when mice were sacrificed. A cohort result from three experiments is presented (B16F10-Ctrl: 8 tumors; B16F10-TRP1: 12 tumors; all other groups: 5 tumors). Nonpaired t test was used for statistical analysis.
FIGURE 2
FIGURE 2
Accumulation of MDSCs and Tregs in tumor lesions is accentuated by immunization in an Ag-dependent manner, A and B, Mice bearing 5-d B16F10 tumors were immunized with TRP1-lv. Single-cell suspensions from tumors were prepared 15 d after immunization and stained for CD45, Thy1.2, CD11b, and Gr-1 (A) or CD45, Thy1.2, CD8, CD4, and FoxP3 (B). Representative plots of MDSCs and Tregs are presented. The percentages and absolute numbers of MDSCs and Tregs are summarized. Unpaired two-tailed t tests were used for statistical analysis (Prism; GraphPad). C, Mice bearing 5-d MO4 tumors were immunized with either TRP1-lv or OVA-lv. The absolute number of MDSCs and Tregs in the tumors was analyzed and calculated 15–18 d later. Experiments in AC were repeated three times with similar observations. D, Mice bearing 5-d MO4 tumors were immunized with lv OVA-lv (lv) or OVA-Ad (Ad). The absolute number of MDSCs and Tregs in the tumor lesions was analyzed and calculated 16–18 d later. The experiment was repeated twice with similar data. E, The immune-suppressive function of MDSCs and Tregs was determined by their inhibition of αCD3-induced CD4 T cell proliferation in vitro. Only the CFSE+ CD4 T cells were gated and analyzed. The numbers on each histogram indicate the percentage of dividing and undivided cells. This experiment was repeated twice with similar results.
FIGURE 3
FIGURE 3
PD-1 expression on TILs increases with tumor growth, and the PD-L1 expression is induced in tumor lesions by lv immunization. A and B, Single-cell suspensions from the spleen and tumor of the immunized or nonimmunized control mice were collected at indicated time points and stained with CD45, Thy1.2, CD8, and PD-1 Abs. CD8 T cells were gated, and the PD-1 expression was analyzed (A). PD-1 expression on the CD8 TILs from tumors of different sizes was compared (B). The numbers represent the percentage of PD-1+ CD8 T cells in the tumor. Shaded area, isotype staining control; dotted line, spleen CD8 T cells; solid line, CD8 TILs. C, To investigate the PD-L1 expression, single cells from the spleen and tumor lesions were stained for CD45, Thy1.2, and PD-L1. Live cell gate was set based on the forward and side scatter. CD45+Thy1.2+ (T cells), CD45+Thy1.2 (non-T leukocytes), and CD45Thy1.2 (tumor cells) were gated and analyzed for their expression of PD-L1. The numbers on the figure denote the percentage of PD-L1+ cells and the MFI of PD-L1 of the cells from tumor lesions. Shaded area, isotype control; dotted line, splenocytes; solid line, TILs or tumor cells. These figures depict the representative data from five mice. The experiments were repeated three times with similar results. D, In vitro induction of PD-L1 expression on B16F10 cells. B16F10 cells in the culture were treated with or without 10 ng/ml IFN-γ for 12 h and analyzed for PD-L1 expression. Filled histogram represents the isotype control; dashed and solid lines indicate the B16F10 cells without and with IFN-γ treatment, respectively.
FIGURE 4
FIGURE 4
CD8 TILs possess a reduced capability of producing multiple effector cytokines and degranulation. A, Twenty days after tumor inoculation (15 d postimmunization), single-cell suspensions from the spleen and tumor of immunized mice were restimulated in vitro with TRP1 peptides for 3 h and then stained for IFN-γ and TNF-α (top panels). Alternatively, CD107a and IFN-γ staining was performed (bottom panels). Only CD8 T cells were gated and presented in the figures. The numbers in each quadrant of the dot plot represent the percentage and MFI of IFN-γ and TNF-α. B, Summary of the percentage of IFN-γ+ CD8 T cells in the spleen and tumors is presented. C, The percentage of IFN-γ+TNF-α+ double-positive cells out of the total IFN-γ+ cells (left) and the percentage of IFN-γ+CD107a+ double-positive cells out of the total CD107a+ cells (right) is shown. D, The MFI of IFN-γ+, TNF-α+, and CD107a+ CD8 T cells are summarized. This experiment was repeated three times with similar results. E, Pmel-1 CD8 T cells were adoptively transferred into mice before tumor inoculation and immunization. Cytokine production by pmel-1 in the spleen and tumor was measured 15 d after immunization. A representative dot plot is shown (only the pmel-1 cells were gated and presented). The numbers in each quadrant of the dot plot represent the percentage and MFI of each cytokine. The percentage of IFN-γ+TNF-α+ double-positive, IFN-γ+, and TNF-α+ cells from four mice are also summarized (lower panel). Data are presented as mean ± SE. F, Splenocytes (containing pmel-1) were restimulated ex vivo with peptides in the absence or presence of total cells from the tumor lesions (from a separate mouse without pmel-1 cells). Cytokine production from the pmel-1 cells of spleen origin was examined by intracellular staining. A typical dot plot of gated pmel-1 cells is presented. Summary of the IFN-γ+TNF-α+, IFN-γ+, or TNF-α+ percentages of pmel-1 from five mice is also shown (lower panel). Data are presented as mean ± SE. The unpaired t test was used for statistical analysis. Two experiments were performed with similar results.
FIGURE 5
FIGURE 5
In vitro PD-1/PD-L1 blockade partially recovers the lost effector function of CD8 TILs. Splenocytes and total cells of the tumor lesions were prepared from the tumor-bearing mice after pmel-1 adoptive transfer and hgp100-lv immunization. Cells were restimulated ex vivo with peptide in the presence or absence of PD1 and PD-L1 Abs. Cytokine production was determined by intracellular staining of IFN-γ and TNF-α. A representative result with five mice is presented.
FIGURE 6
FIGURE 6
In vivo PD-1/PD-L1 blockade partially recovers the effector function of CD8 TILs and enhances the antitumor efficacy of lv immunization. A, Mice bearing 5-d B16F10 tumors were immunized by TRP1-lv with PD1 and PD-L1 Ab or Rat IgG isotype Ab. Tumor cell suspensions were prepared and stained for cytokines and CD107a. Only CD8 T cells are shown in the representative dot plots. A summary of the cytokine production (mean ± SE) from five mice in each group is presented. B and C, Tumor growth was monitored, and the average tumor area of five tumors in each group is shown (B), and tumor weight was recorded at the end of the experiment (C). D and E, The percentages of MDSCs (D) and Tregs (E) in the tumor lesions was analyzed as described in Fig. 2. The unpaired t test was used for statistical analysis. The experiment was repeated twice with similar results.
FIGURE 7
FIGURE 7
In vivo PD-1/PD-L1 blockade partially rescues the effector function of pmel-1 in the tumor lesions. A–D, Mice were adoptively transferred with pmel-1 cells and inoculated with B16F10 tumor cells. Mice bearing 5-d tumors were immunized with hgp100-lv with either αPD-1 and αPD-L1 Abs or isotype Ab. Single cells were prepared from spleen and tumor lesions, and their effector function was determined by ex vivo staining. Representative dot plots (gated pmel-1 cells) of multiple cytokine production (A) and degranulation (B) are presented. The numbers in each quadrant represent the percentage of positive cells and the MFI of indicated cytokines of each population. The cytokine production of pmel-1 cells in both spleen (C) and tumor (D) is summarized from five mice. E and F, Tumor growth curve (E) of each treatment group and tumor weight (F) at the end of the experiments are also summarized and presented. Each line represents an individual mouse. These experiments were repeated twice with similar observations.

References

    1. Elsawa SF, Rodeberg DA, Celis E. T-cell epitope peptide vaccines. Expert Rev. Vaccines. 2004;3:563–575. - PubMed
    1. Melief CJ. Cancer immunotherapy by dendritic cells. Immunity. 2008;29:372–383. - PubMed
    1. Anderson RJ, Schneider J. Plasmid DNA and viral vector-based vaccines for the treatment of cancer. Vaccine. 2007;25 Suppl 2:B24–B34. - PubMed
    1. Harrop R, John J, Carroll MW. Recombinant viral vectors: cancer vaccines. Adv. Drug Deliv. Rev. 2006;58:931–947. - PubMed
    1. He Y, Zhang J, Donahue C, Falo LD., Jr Skin-derived dendritic cells induce potent CD8(+) T cell immunity in recombinant lv-mediated genetic immunization. Immunity. 2006;24:643–656. - PMC - PubMed

Publication types

MeSH terms