. 2010;76(1):45-59.
doi: 10.1159/000319019. Epub 2010 Sep 30.

Cellular scaling rules for primate spinal cords

Affiliations

Cellular scaling rules for primate spinal cords

Mark J Burish et al. Brain Behav Evol. 2010.

Abstract

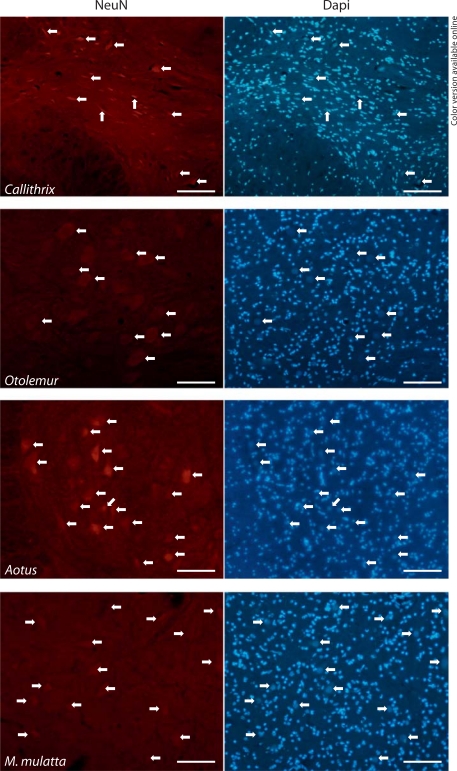
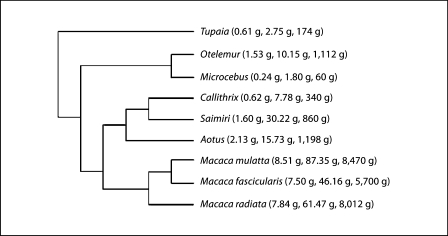
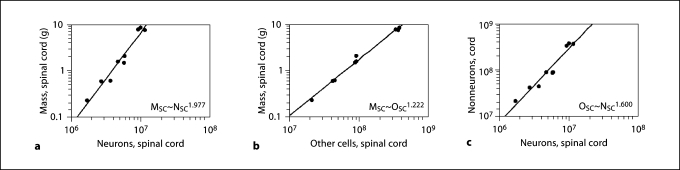
The spinal cord can be considered a major sensorimotor interface between the body and the brain. How does the spinal cord scale with body and brain mass, and how are its numbers of neurons related to the number of neurons in the brain across species of different body and brain sizes? Here we determine the cellular composition of the spinal cord in eight primate species and find that its number of neurons varies as a linear function of cord length, and accompanies body mass raised to an exponent close to 1/3. This relationship suggests that the extension, mass and number of neurons that compose the spinal cord are related to body length, rather than to body mass or surface. Moreover, we show that although brain mass increases linearly with cord mass, the number of neurons in the brain increases with the number of neurons in the spinal cord raised to the power of 1.7. This faster addition of neurons to the brain than to the spinal cord is consistent with current views on how larger brains add complexity to the processing of environmental and somatic information.


Figures

Fig. 1
Fig. 1
Neuronal identity of NeuN-stained nuclei in the spinal cord is confirmed by nuclear morphology. Each pair of photomicrographs shows DAPI- and NeuN-stained nuclei in the same field of immunostained transverse sections of the spinal cord of Callithrix, Otolemur, Aotus and M. mulatta. Arrows point to nuclei of clearly distinct morphology (either elongated, or very large and round, and always of low chromatin density). Notice that all DAPI-stained nuclei of such morphology are also stained with NeuN. Bars: 100 μm.
Fig. 2
Fig. 2
Phylogenetic relationship of the primate and Scandentia species analyzed. Average spinal cord, brain and body mass for each species are shown in parentheses. Phylogenetic relationships are based on Purvis [1995] and Murphy et al. [2001a, b].
Fig. 3
Fig. 3
Spinal cord and brain mass increase as power functions of body mass. Each point represents the average spinal cord (a) or brain mass (b; ordinate) and average body mass (abscissa) for each of 8 primate species and the tree shrew. Plotted lines are power functions calculated for all 9 species, with the exponents indicated (both values of p < 0.0001). MBD = Average body mass; MBR = average brain mass. MSC = average mass of spinal cord.
Fig. 4
Fig. 4
Cellular scaling rules for the spinal cord. Cord mass (ordinate) increases as power functions of total number of neurons (a) and total number of other (nonneuronal) cells (b) in the spinal cord (abscissa). Each point represents the average values for each of 8 primate species and the tree shrew. c Total number of other cells increases faster than the total number of neurons in the spinal cord. Plotted lines are power functions calculated for all 9 species, with the respective exponents indicated (all values of p < 0.0001). MSC = Average mass of spinal cord; NSC = average number of neurons in the spinal cord; OSC = average number of other (nonneuronal) cells in the spinal cord.
Fig. 5
Fig. 5
Spinal cord mass and length scaling. a Spinal cord mass varies with cord length raised to an exponent of close to 3.0. b Spinal cord length varies with body mass raised to an exponent that is significantly smaller than 1/3 (95% CI, 0.171–0.289). Each point represents the average values available for each of 5 primate species and the tree shrew. Plotted lines are power functions calculated for all 6 species, with the exponents indicated (p = 0.0005 and p = 0.0004, respectively). LSC = Average length of spinal cord; MBD = average body mass; MSC = average mass of spinal cord.
Fig. 6
Fig. 6
Cellular composition of the spinal cord scales with cord length. The total number of spinal cord neurons increases with body mass raised to the power of 0.360, close to 1/3 (a), and as a linear function of spinal cord length (b), with on average 43,075 neurons per millimeter. In contrast, the total number of other (nonneuronal) cells in the spinal cord increases as a steep power function of cord length (c). Each point represents the average value for each of 8 primate species and the tree shrew. Plotted power (a, c) or linear (b) functions were calculated for all 9 species, and the respective exponents (a, c) or constant (b) are indicated (p < 0.0001; r2 = 0.918, p = 0.0004; and p = 0.0014 for a–c, respectively). LSC = Average length of spinal cord; MBD = average body mass; NSC = average number of neurons in the spinal cord; NNSC = average number of nonneurons in the spinal cord.
Fig. 7
Fig. 7
Spinal cord length is more directly related than body mass to brain mass and number of neurons. a Normalized residuals for body mass (open circles), spinal cord mass (open triangles) and spinal cord length (filled circles) calculated onto brain mass for primate species in our dataset (gray area) and in an independent dataset [MacLarnon, 1996]. b Normalized residuals for brain mass (open circles) and spinal cord length (filled circles) calculated onto number of brain neurons for the primate species in our dataset. Mean residuals and standard errors are indicated for each dataset. LSC = Average length of spinal cord; MBD = average body mass; MBR = average brain mass; MSC = average mass of spinal cord; NBR = average number of neurons in the brain.
Fig. 8
Fig. 8
Scaling of neuronal and nonneuronal densities in the spinal cord. a, b Neuronal density in the spinal cord, calculated as the number of neurons per milligram of spinal cord, decreases with approximately the square root of spinal cord mass (a; p < 0.0001), and decreases linearly with increasing cord length (b; r2 = 0.971, p = 0.0003). Each point represents the average values for each of 8 primate species and the tree shrew. c Nonneuronal density in the spinal cord, calculated as the number of nonneuronal cells/mg of spinal cord, decreases as a power function of increasing spinal cord mass (p = 0.0004). DN = average density of neurons per milligram of tissue in the spinal cord; DO = average density of other (nonneuronal) cells per milligram of tissue in the spinal cord; LSC = average length of spinal cord; MSC = average mass of spinal cord.
Fig. 9
Fig. 9
Intraspecific scaling of nonneuronal density in the spinal cord. Nonneuronal density in the spinal cord, calculated as the number of nonneuronal cells per milligram of spinal cord, decreases as similar power functions of increasing spinal cord mass across tree shrew, galago and owl monkey individuals. Each line represents the power function within a species, with exponents indicated above (p = 0.0088, p = 0.0221 and p = 0.0010, respectively). Each point represents 1 individual.
Fig. 10
Fig. 10
Brain mass increases linearly with cord mass. Graphs depict how the mass of the whole brain (a), cerebral cortex (b), cerebellum (c) and remaining areas of the brain (d) scale as power functions of spinal cord mass with exponents close to 1.0 or slightly below 1.0. Each point represents the average values for each of eight primate species and the tree shrew. Plotted lines are power functions calculated for all 9 species, with the respective exponents indicated (p < 0.0001, p < 0.0001, p = 0.0004 and p = 0.0003, respectively). MBR = Average brain mass; MCB = average mass of the cerebellum; MCX = average mass of the cortex; MRA = average mass of the remaining areas; MSC = average mass of spinal cord.
Fig. 11
Fig. 11
Numbers of neurons in the brain, cerebral cortex and cerebellum increase faster than number of neurons in the spinal cord. Graphs depict how numbers of neurons in the whole brain (a), cerebral cortex (b), cerebellum (c) scaleas power functions of the number of neurons in the spinal cord with exponents well above 1.0, while the number of neurons in the remaining areas (d) scales approximately linearly with the number of neurons in the spinal cord. Each point represents the average values for each of eight primate species and the tree shrew. Plotted lines are power functions calculated for all 9 species, with the respective exponents indicated (p = 0.0009, p = 0.0017, p = 0.0007 and p = 0.0041, respectively). NBR = Average number of neurons in the brain; NCB = average number of neurons in the cerebellum; NCX = average number of neurons in the cortex; NRA = average number of neurons in the remaining areas; NSC = average number of neurons in the spinal cord.

References

    1. Azevedo FA, Carvalho LR, Grinberg LT, Farfel JM, Ferretti RE, Leite RE, Jacob Filho W, Lent R, Herculano-Houzel S. Equal numbers of neuronal and nonneuronal cells make the human brain an isometrically scaled-up primate brain. J Comp Neurol. 2009;513:532–541. - PubMed
    1. Barson AJ. The vertebral level of termination of the spinal cord during normal and abnormal development. J Anat. 1970;106:489–497. - PMC - PubMed
    1. Barton RA, Dunbar RIM. Evolution of the social brain. In: Whiten AW, Byrne RW, editors. Machiavellian Intelligence. II. Evaluations and Extenstions. New York: Cambridge University Press; 1997. pp. 240–263.
    1. Burish MJ, Peebles JK, Kaas JH, Herculano-Houzel S (2007): Cellular scaling rules for primate spinal cord. Soc Neurosci Abstr 193.4. - PMC - PubMed
    1. Byrne RW, Whiten A. Machiavellian Intelligence: Social Expertise and the Evolution of Intellect in Monkeys, Apes, and Humans. Oxford: Clarendon Press; 1988.

Publication types