

Inferring regulatory networks from expression data using tree-based methods
- PMID: 20927193
- PMCID: PMC2946910
- DOI: 10.1371/journal.pone.0012776
Inferring regulatory networks from expression data using tree-based methods
Abstract
One of the pressing open problems of computational systems biology is the elucidation of the topology of genetic regulatory networks (GRNs) using high throughput genomic data, in particular microarray gene expression data. The Dialogue for Reverse Engineering Assessments and Methods (DREAM) challenge aims to evaluate the success of GRN inference algorithms on benchmarks of simulated data. In this article, we present GENIE3, a new algorithm for the inference of GRNs that was best performer in the DREAM4 In Silico Multifactorial challenge. GENIE3 decomposes the prediction of a regulatory network between p genes into p different regression problems. In each of the regression problems, the expression pattern of one of the genes (target gene) is predicted from the expression patterns of all the other genes (input genes), using tree-based ensemble methods Random Forests or Extra-Trees. The importance of an input gene in the prediction of the target gene expression pattern is taken as an indication of a putative regulatory link. Putative regulatory links are then aggregated over all genes to provide a ranking of interactions from which the whole network is reconstructed. In addition to performing well on the DREAM4 In Silico Multifactorial challenge simulated data, we show that GENIE3 compares favorably with existing algorithms to decipher the genetic regulatory network of Escherichia coli. It doesn't make any assumption about the nature of gene regulation, can deal with combinatorial and non-linear interactions, produces directed GRNs, and is fast and scalable. In conclusion, we propose a new algorithm for GRN inference that performs well on both synthetic and real gene expression data. The algorithm, based on feature selection with tree-based ensemble methods, is simple and generic, making it adaptable to other types of genomic data and interactions.
Conflict of interest statement
Figures
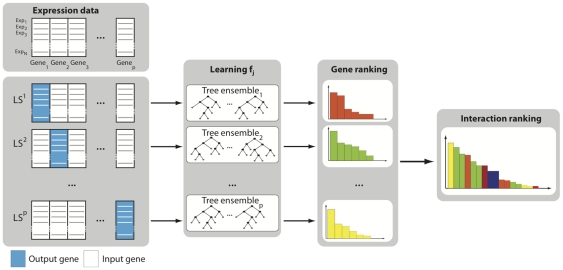
 , a learning sample
  is generated with expression levels of j as output values and expression levels of all other genes as input values. A function
  is learned from
  and a local ranking of all genes except j is computed. The p local rankings are then aggregated to get a global ranking of all regulatory links.
 .
.
 .
.
References
-
- Bolouri H. Computational Modeling of Gene Regulatory Networks - a Primer. Imperial College Press; 2008.
-
- Gardner TS, Faith JJ. Reverse-engineering transcription control networks. Physics of Life Reviews. 2005;2:65–88. - PubMed
-
- Lee WP, Tzou WS. Computational methods for discovering gene networks from expression data. Brief Bioinform. 2009;10:408–423. - PubMed
Publication types
MeSH terms
LinkOut - more resources
Full Text Sources
Other Literature Sources
Miscellaneous
