. 2010 Sep 29;5(9):e13066.
doi: 10.1371/journal.pone.0013066.

Ontology-based meta-analysis of global collections of high-throughput public data

Affiliations

Ontology-based meta-analysis of global collections of high-throughput public data

Ilya Kupershmidt et al. PLoS One. .

Abstract

Background: The investigation of the interconnections between the molecular and genetic events that govern biological systems is essential if we are to understand the development of disease and design effective novel treatments. Microarray and next-generation sequencing technologies have the potential to provide this information. However, taking full advantage of these approaches requires that biological connections be made across large quantities of highly heterogeneous genomic datasets. Leveraging the increasingly huge quantities of genomic data in the public domain is fast becoming one of the key challenges in the research community today.

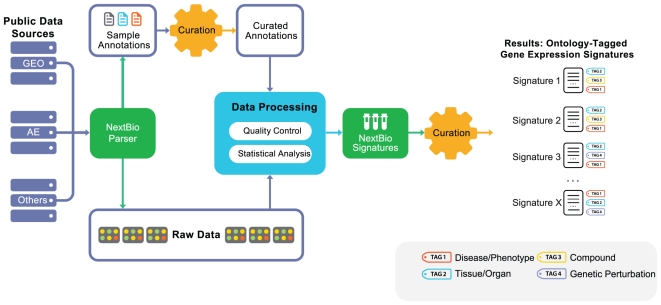
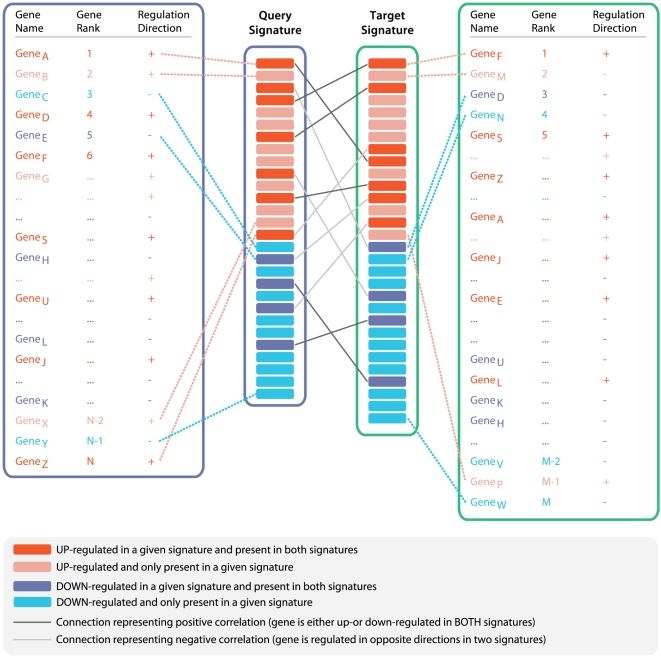
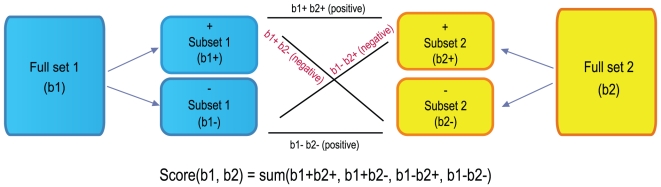
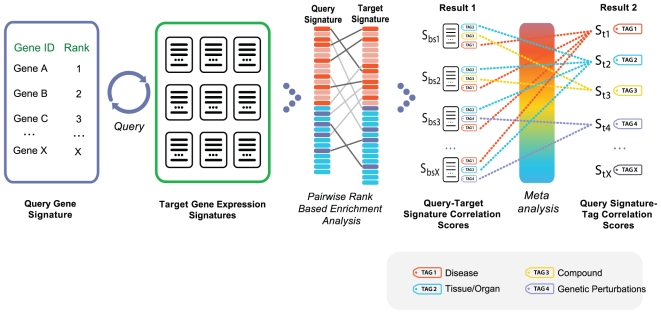
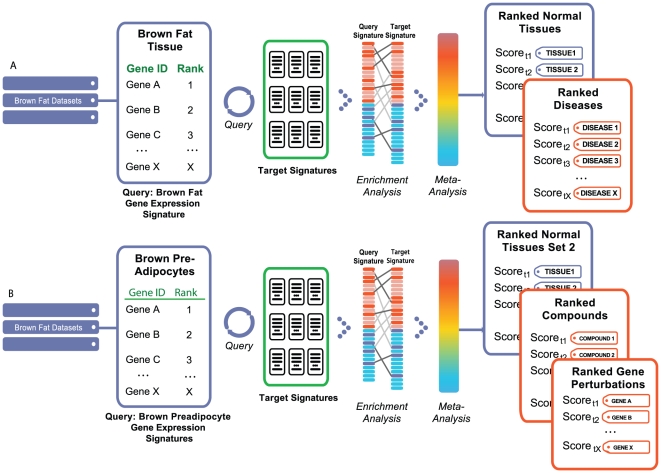
Methodology/results: We have developed a novel data mining framework that enables researchers to use this growing collection of public high-throughput data to investigate any set of genes or proteins. The connectivity between molecular states across thousands of heterogeneous datasets from microarrays and other genomic platforms is determined through a combination of rank-based enrichment statistics, meta-analyses, and biomedical ontologies. We address data quality concerns through dataset replication and meta-analysis and ensure that the majority of the findings are derived using multiple lines of evidence. As an example of our strategy and the utility of this framework, we apply our data mining approach to explore the biology of brown fat within the context of the thousands of publicly available gene expression datasets.

Conclusions: Our work presents a practical strategy for organizing, mining, and correlating global collections of large-scale genomic data to explore normal and disease biology. Using a hypothesis-free approach, we demonstrate how a data-driven analysis across very large collections of genomic data can reveal novel discoveries and evidence to support existing hypothesis.


Conflict of interest statement

Competing Interests: All of the authors are employed by a commercial company, NextBio (with the exception of the last author, Mostafa Ronaghi, who is employed by Illumina). There are also a number of patents filed with respect to the technology and algorithms described in the article. NextBio also provides a commercial software platform in both free and paid versions. These competing interests do not alter the authors' adherence to all the PLoS ONE policies on sharing data and materials.

Figures

Figure 1
Figure 1. Public data processing and analysis pipeline diagram.
The steps for turning public datasets into processed gene signatures include: raw data collection, sample annotation curation, data quality control, automated analysis, and manual tagging of resulting signatures with disease, tissue, compound ontology, and gene perturbation terms (tags). Curation of sample annotation includes a systematic analysis of all sample attributes that should be processed for differential expression. The data processing step converts original raw data into processed results – gene expression signatures representative of a given biological condition. The final tagging step ensures that key biological conditions associated with each signature are captured with standardized vocabulary terms, enabling downstream meta-analysis.
Figure 2
Figure 2. Computing pairwise signature correlation scores.
The algorithm represented by this schematic computes an enrichment score and p-value between two ranked gene signatures. Dark red and blue colored boxes indicate genes present in both signatures; light red and blue colored boxes represent genes present in only one of the signatures. Dark lines connecting genes in each signature represent connections between genes with the same direction of regulation in both signatures. Light lines connect genes with opposite direction in two signatures.
Figure 3
Figure 3. Computing directionality and final correlation scores between two signatures.
The directional subsets are formed for both b1 and b2, and subset-subset enrichment scores are Computed for b1+b2+, b1+b2, b1b2+, and b1b2. Pairwise correlation scores for the directional subsets are positive where subsets are of the same direction and negative sign otherwise. The correlation scores of the subsets are summed up to give the final score for full set b1 versus full set b2.
Figure 4
Figure 4. Gene signature query against all other signatures within the system.
First, pairwise gene signature correlation scores (using rank-based enrichment statistics) are computed, followed by meta-analysis of individual score-tag pairs to compute overall tag scores. This two step process results in computation of direct correlations between user's defined signature and diverse biological conditions representing normal tissues and cell types, diseases, and compounds. Furthermore, overall positive or negative correlation between a signature and a concept is computed based on individual pairwise signature correlation scores. A positive correlation implies a similar up- and down-regulation of genes in each signature or signature-tag pair, while a negative correlation implies the opposite trend.
Figure 5
Figure 5. Brown fat meta-analysis.
Diagram representing analyses of two different brown fat related signatures: (a) Brown fat tissue signature (relative to all other mouse tissues). (b) Signature of brown preadipocytes vs. white preadipocytes. After computing pairwise scores between query and all target signatures the meta-analysis of pairwise scores and their associated tags (associated disease, tissue, and compound terms) is performed. The final result produces a ranked set of tissues, diseases, and compounds with the most significant association to query signature.

References

    1. Gardiner-Garden M, Littlejohn TG. A comparison of microarray databases. Brief Bioinform. 2001;2:143–158. - PubMed
    1. Rhodes DR, Barrette TR, Rubin MA, Ghosh D, Chinnaiyan AM. Meta-analysis of microarrays: interstudy validation of gene expression profiles reveals pathway dysregulation in prostate cancer. Cancer Res. 2002;62:4427–4433. - PubMed
    1. Ghosh D, Barette TR, Rhodes D, Chinnaiyan AM. Statistical issues and methods for meta-analysis of microarray data: a case study in prostate cancer. Funct Integr Genomics. 2003;3:180–188. - PubMed
    1. Jiang H, Deng Y, Chen HS, Tao L, Sha Q, et al. Joint analysis of two microarray gene-expression data sets to select lung adenocarcinoma marker genes. BMC Bioinformatics. 2004;5:81. - PMC - PubMed
    1. Griffith OL, Melck A, Jones SJM, Wiseman SM. Meta-analysis and meta-review of thyroid cancer gene expression profiling studies identifies important diagnostic biomarkers. J Clin Oncol. 2006;24:5043–5051. - PubMed

Publication types