Comparative Study
. 2011 Mar;17(5-6):713-24.
doi: 10.1089/ten.TEA.2010.0273. Epub 2010 Dec 7.

Direct comparisons of the morphology, migration, cell adhesions, and actin cytoskeleton of fibroblasts in four different three-dimensional extracellular matrices

Affiliations
Comparative Study

Direct comparisons of the morphology, migration, cell adhesions, and actin cytoskeleton of fibroblasts in four different three-dimensional extracellular matrices

Kirsi M Hakkinen et al. Tissue Eng Part A. 2011 Mar.

Abstract

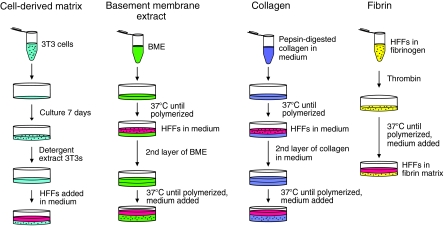
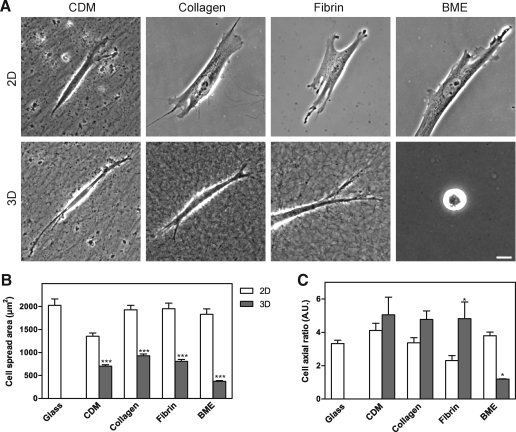
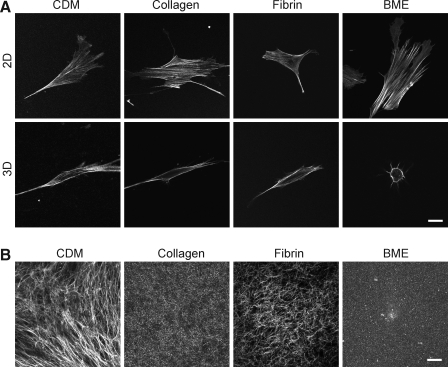
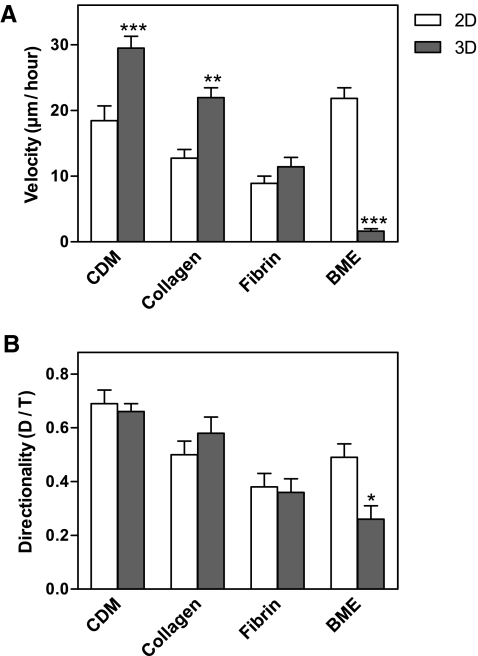
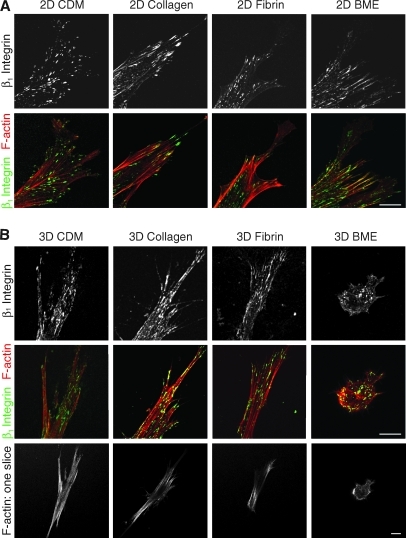
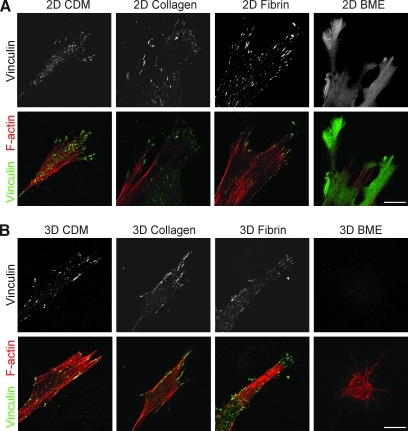
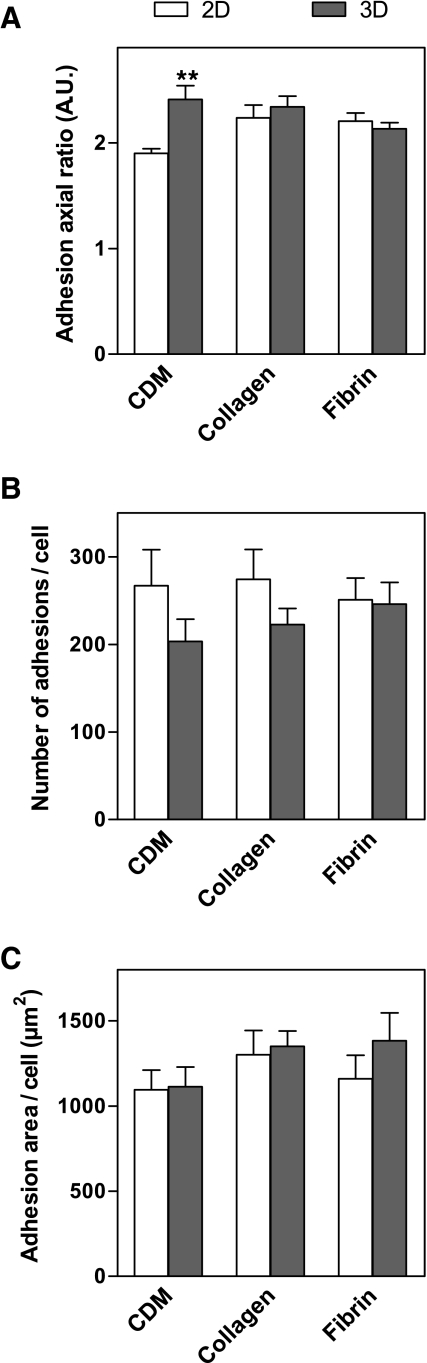
Interactions between cells and the extracellular matrix are at the core of tissue engineering and biology. However, most studies of these interactions have used traditional two-dimensional (2D) tissue culture, which is less physiological than three-dimensional (3D) tissue culture. In this study, we compared cell behavior in four types of commonly used extracellular matrix under 2D and 3D conditions. Specifically, we quantified parameters of cell adhesion and migration by human foreskin fibroblasts in cell-derived matrix or hydrogels of collagen type I, fibrin, or basement membrane extract (BME). Fibroblasts in 3D were more spindle shaped with fewer lateral protrusions and substantially reduced actin stress fibers than on 2D matrices; cells failed to spread in 3D BME. Cell-matrix adhesion structures were detected in all matrices. Although the shapes of these cell adhesions differed, the total area per cell occupied by cell-matrix adhesions in 2D and 3D was nearly identical. Fibroblasts migrated most rapidly in cell-derived 3D matrix and collagen and migrated minimally in BME, with highest migration directionality in cell-derived matrix. This identification of quantitative differences in cellular responses to different matrix composition and dimensionality should help guide the development of customized 3D tissue culture and matrix scaffolds for tissue engineering.


Figures

FIG. 1.
FIG. 1.
Generation of 3D extracellular matrices. Each matrix was produced as described in the Materials and Methods section at the protein concentration most commonly used in the literature (5 mg/mL CDM, 10 mg/mL BME, 2.5 mg/mL collagen, and 4 mg/mL fibrin). 3D, three-dimensional; BME, basement membrane extract; CDM, cell-derived matrix.
FIG. 2.
FIG. 2.
Morphology of human fibroblasts in 2D and 3D matrices (A) and quantification of cell length, width, and spread area in 2D and 3D matrices. (A) Cells were imaged using phase-contrast microscopy at 24 h after plating on 2D matrix-coated coverslips or into 3D matrices. Scale bar represents 10 μm. (B, C) Cell outlines were determined as described in the Materials and Methods section. The cell spread area (B) was calculated on 2D and 3D substrates after concanavalin A or phalloidin staining. The cells on a 2D surface were nearly twice as large in terms of cell spread area as cells in the comparable 3D matrix. The cell axial ratio (cell length/width) was calculated (C); the cells in 3D BME were unable to spread and thus had an axial ratio close to 1 because their length and width were nearly identical. Scale bar represents 10 μm and error bars indicate standard error. *p < 0.05 and ***p < 0.001. 2D, two-dimensional.
FIG. 3.
FIG. 3.
Actin distribution in primary human fibroblasts on 2D and within 3D matrices (A) and structure of 3D matrices (B). Images of actin in 3D matrices represent a single z slice through the central region midline of each cell. 3D CDM was stained using an antibody to fibronectin. Collagen and BME were visualized using reflection microscopy. Fluorescently labeled fibrinogen was used to visualize the fibrin matrices. Images were acquired using a confocal microscope. Scale bar represents 10 μm.
FIG. 4.
FIG. 4.
Velocity and directionality of fibroblasts migrating in 2D and 3D matrices. Imaging was initiated at 24 h after adding human fibroblasts to matrices. The data were collected by tracking movements of 20–60 cells under each condition in at least three separate experiments. Velocity (A) and directionality (B) were calculated using MetaMorph and Excel. The concentrations of 3T3 CDM, BME, collagen, and fibrin in the matrices were 5.2, 10, 2.5, and 4 mg/mL, respectively. Bars represent standard error. *p < 0.05, **p < 0.01, and ***p < 0.001.
FIG. 5.
FIG. 5.
Distribution of β1 integrin and F-actin in 2D and 3D matrices. Human fibroblasts were cultured on 2D matrix-coated glass coverslips (A) or in 3D matrices (B) and fixed after 24 h of culture. Samples were stained for activated β1 integrin (monoclonal antibody 9EG7, green) and F-actin (phalloidin, red). Images are maximum projections of z slices, unless otherwise indicated. Representative images are shown from three separate experiments. Scale bar represents 10 μm.
FIG. 6.
FIG. 6.
Distribution of vinculin and F-actin in 2D and 3D matrices. Fibroblasts were cultured on 2D matrix-coated glass coverslips (A) or in 3D matrices (B) and fixed after 24 h of culture. Samples were stained for vinculin (green) and F-actin (phalloidin, red). Images are maximum projections of z slices. Representative images are shown from three separate experiments. Scale bar represents 10 μm.
FIG. 7.
FIG. 7.
Quantification of cell adhesions in 2D and 3D matrices. Z projections of β1 staining of human fibroblasts in 2D and 3D matrices were created. The axial ratio (A) of the cell adhesions were compared for each of the 3D and corresponding 2D matrices. The average number of cell adhesions per cell was also compared (B), along with the total area covered by cell adhesions per cell (C). Statistical analyses were performed using analysis of variance and Tukey posttests (n = 8–13 cells). **p < 0.01.

References

    1. Cukierman E. Pankov R. Stevens D.R. Yamada K.M. Taking cell-matrix adhesions to the third dimension. Science. 2001;294:1708. - PubMed
    1. Roskelley C.D. Desprez P.Y. Bissell M.J. Extracellular matrix-dependent tissue-specific gene expression in mammary epithelial cells requires both physical and biochemical signal transduction. Proc Natl Acad Sci USA. 1994;91:12378. - PMC - PubMed
    1. Streuli C.H. Bailey N. Bissell M.J. Control of mammary epithelial differentiation: basement membrane induces tissue-specific gene expression in the absence of cell-cell interaction and morphological polarity. J Cell Biol. 1991;115:1383. - PMC - PubMed
    1. Nelson C.M. Bissell M.J. Of extracellular matrix, scaffolds, and signaling: tissue architecture regulates development, homeostasis, and cancer. Annu Rev Cell Dev Biol. 2006;22:287. - PMC - PubMed
    1. Sun T. Jackson S. Haycock J.W. MacNeil S. Culture of skin cells in 3D rather than 2D improves their ability to survive exposure to cytotoxic agents. J Biotechnol. 2006;122:372. - PubMed

Publication types

MeSH terms