. 2010;12(5):R184.
doi: 10.1186/ar3152. Epub 2010 Oct 7.

Rheumatoid synovial fluid interleukin-17-producing CD4 T cells have abundant tumor necrosis factor-alpha co-expression, but little interleukin-22 and interleukin-23R expression

Affiliations

Rheumatoid synovial fluid interleukin-17-producing CD4 T cells have abundant tumor necrosis factor-alpha co-expression, but little interleukin-22 and interleukin-23R expression

Leigh D Church et al. Arthritis Res Ther. 2010.

Abstract

Introduction: Th17 cells have been implicated in the pathogenesis of rheumatoid arthritis (RA). The aim of this study was to systematically analyse the phenotype, cytokine profile and frequency of interleukin-17 (IL-17) producing CD4-positive T cells in mononuclear cells isolated from peripheral blood, synovial fluid and synovial tissue of RA patients with established disease, and to correlate cell frequencies with disease activity.

Methods: Flow cytometry was used to analyse the phenotype and cytokine production of mononuclear cells isolated from peripheral blood (PBMC) (n = 44), synovial fluid (SFMC) (n = 14) and synovium (SVMC) (n = 10) of RA patients and PBMC of healthy controls (n = 13).

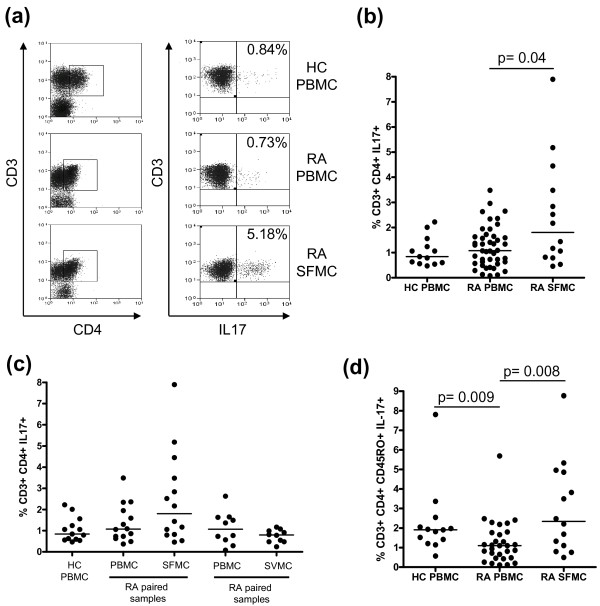
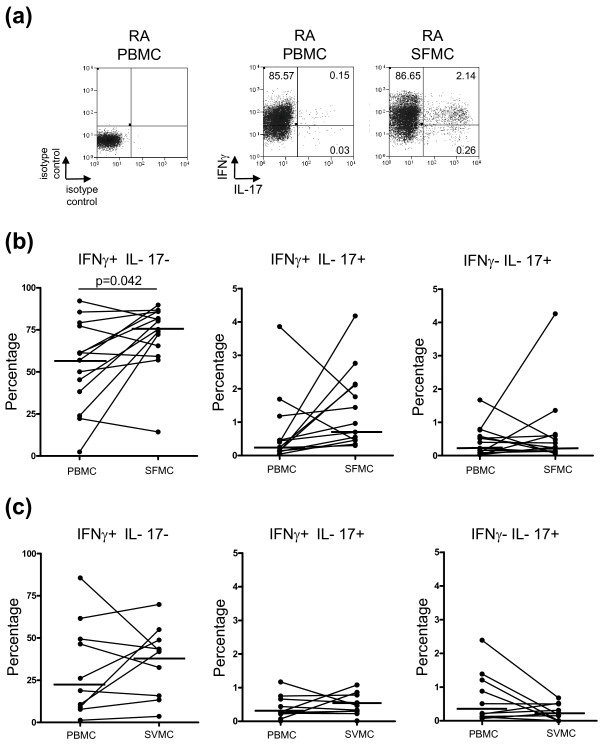
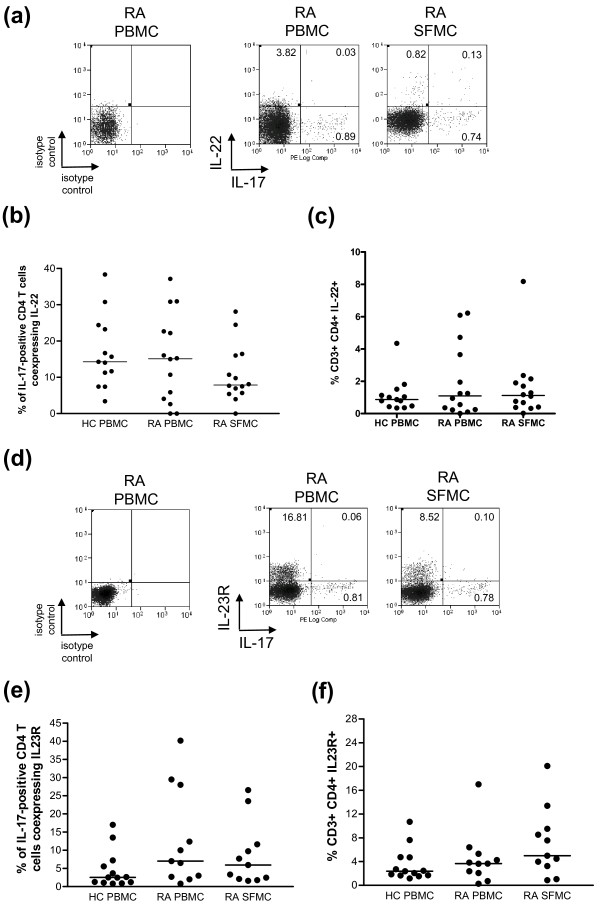
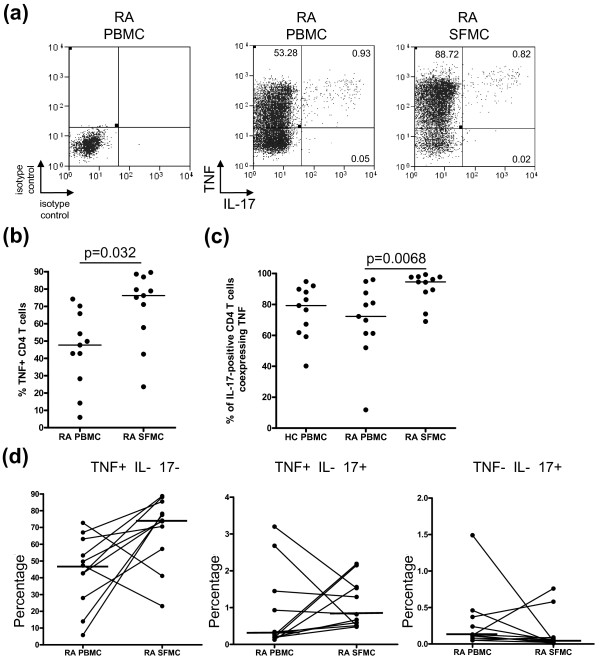
Results: The frequency of IL-17-producing CD4 T cells was elevated in RA SFMC compared with RA PBMC (P = 0.04). However, the frequency of this population in RA SVMC was comparable to that in paired RA PBMC. The percentage of IL-17-producing CD4 T cells coexpressing tumor necrosis factor alpha (TNFα) was significantly increased in SFMC (P = 0.0068). The frequency of IFNγ-producing CD4 T cells was also significantly higher in SFMC than paired PBMC (P = 0.042). The majority of IL-17-producing CD4 T cells coexpressed IFNγ. IL-17-producing CD4 T cells in RA PBMC and SFMC exhibited very little IL-22 or IL-23R coexpression.

Conclusions: These findings demonstrate a modest enrichment of IL-17-producing CD4 T cells in RA SFMC compared to PBMC. Th17 cells in SFMC produce more TNFα than their PBMC counterparts, but are not a significant source of IL-22 and do not express IL-23R. However, the percentage of CD4 T cells which produce IL-17 in the rheumatoid joint is low, suggesting that other cells may be alternative sources of IL-17 within the joints of RA patients.


Figures

Figure 1
Figure 1
Frequency of IL-17-positive CD4 T cells in PBMC, SFMC, and synovium (SVMC) of RA patients versus PBMC of healthy donors. Cells were stimulated with PMA and ionomycin in the presence of brefeldin A. A) Representative plots of IL-17 staining on PBMC of healthy controls (HC), RA PBMC, and RA SFMC are shown against CD3. Cells were first gated on CD3 and CD4 expression. The percentages of IL-17 positive cells are indicated. B) The frequency of IL-17-positive CD4 T cells was compared between RA and healthy control samples. Data from healthy control PBMC (n = 13), RA PBMC (n = 44) and SFMC samples (n = 14) are shown. C) Data from healthy control PBMC (n = 13), RA paired PBMC and SFMC samples (n = 14) and paired RA PBMC and SVMC samples are shown (n = 10). D) The frequency of IL-17-positive CD4 CD45RO T cells was compared between healthy donor PBMC (n = 13), RA PBMC (n = 44) and RA SFMC (n = 14). Bars representing the medians are shown within the dot plots. P-values less than 0.05 were considered significant.
Figure 2
Figure 2
IFNγ co-expression by IL-17-positive CD4 T cells in PBMC, SFMC, and SVMC of patients with RA. A) Representative plots of the expression of IFNg against IL-17 in CD4 T cells from isolated PBMC and SFMC are shown. The frequencies of IFNγ-positive IL-17-negative, IFNγ-positive IL-17-positive, IFNγ-negative IL-17-positive cells gated on CD4 T cells in B) RA PBMC and SFMC, C) RA PBMC and SVMC, are shown. Bars representing the medians are shown within the plots.
Figure 3
Figure 3
Analysis of IL-22 and IL-23R expression on IL-17-positive CD4 T cells in PBMC and SFMC of patients with RA. A) Representative plots of the expression of IL-22 against IL-17 in CD4 T cells from isolated PBMC and SFMC are shown. B) The percentages of IL-17-positive CD4 T cells coexpressing IL-22 in PBMC from healthy donors (n = 13), paired RA PBMC and SFMC samples (n = 14) are shown. C) The frequencies of IL-22-positive CD4 T cells in HC PBMC, RA PBMC and paired SFMC are shown. D) Representative plots of the expression of IL-23R against IL-17 in CD4 T cells from isolated PBMC and SFMC are shown. E) The percentages of IL-17-positive CD4 T cells coexpressing IL-23R in PBMC from healthy donors (n = 13) and paired RA PBMC and SFMC samples (n = 11) are shown. F) The frequency of IL-23R-positive CD4 T cells was compared between healthy donor PBMC (n = 13), RA PBMC and RA SFMC (n = 11). Bars representing the median are shown within the dot plots.
Figure 4
Figure 4
Coexpression of TNFα by IL-17-producing CD4 T cells in PBMC and SFMC of patients with RA. A) Representative plots of the expression of TNFα against IL-17 in CD4 T cells from isolated PBMC and SFMC are shown. B) The percentages TNFα-positive CD4 T cells in PBMC (n = 11) and SFMC (n = 11) of RA patients. C) The percentages of IL-17-positive CD4 T cells coexpressing TNFα in PBMC from healthy donors (n = 11), paired RA PBMC and SFMC samples (n = 11) are shown. D) The frequencies of TNFα-positive IL-17-negative, TNFα-positive IL-17-positive, TNFα-negative IL-17-positive gated on CD4 T cells in RA PBMC and SFMC are shown. Bars representing the median are shown within the dot plot. The results of statistical analysis are shown within the plots. P-values less than 0.05 were considered significant.

References

    1. Firestein GS. Evolving concepts of rheumatoid arthritis. Nature. 2003;423:356–361. doi: 10.1038/nature01661. - DOI - PubMed
    1. Morita Y, Yamamura M, Kawashima M, Harada S, Tsuji K, Shibuya K, Maruyama K, Makino H. Flow cytometric single-cell analysis of cytokine production by CD4+ T cells in synovial tissue and peripheral blood from patients with rheumatoid arthritis. Arthritis Rheum. 1998;41:1669–1676. doi: 10.1002/1529-0131(199809)41:9<1669::AID-ART19>3.0.CO;2-G. - DOI - PubMed
    1. Simon AK, Seipelt E, Sieper J. Divergent T-cell cytokine patterns in inflammatory arthritis. Proc Natl Acad Sci USA. 1994;91:8562–8566. doi: 10.1073/pnas.91.18.8562. - DOI - PMC - PubMed
    1. Harrington LE, Hatton RD, Mangan PR, Turner H, Murphy TL, Murphy KM, Weaver CT. Interleukin 17-producing CD4+ effector T cells develop via a lineage distinct from the T helper type 1 and 2 lineages. Nat Immunol. 2005;6:1123–1132. doi: 10.1038/ni1254. - DOI - PubMed
    1. Park H, Li Z, Yang XO, Chang SH, Nurieva R, Wang YH, Wang Y, Hood L, Zhu Z, Tian Q, Dong C. A distinct lineage of CD4 T cells regulates tissue inflammation by producing interleukin 17. Nat Immunol. 2005;6:1133–1141. doi: 10.1038/ni1261. - DOI - PMC - PubMed

Publication types