. 2011 Mar;119(3):299-305.
doi: 10.1289/ehp.1002060. Epub 2010 Oct 6.

Uncertainties associated with quantifying climate change impacts on human health: a case study for diarrhea

Affiliations

Uncertainties associated with quantifying climate change impacts on human health: a case study for diarrhea

Erik W Kolstad et al. Environ Health Perspect. 2011 Mar.

Abstract

Background: Climate change is expected to have large impacts on health at low latitudes where droughts and malnutrition, diarrhea, and malaria are projected to increase.

Objectives: The main objective of this study was to indicate a method to assess a range of plausible health impacts of climate change while handling uncertainties in a unambiguous manner. We illustrate this method by quantifying the impacts of projected regional warming on diarrhea in this century.

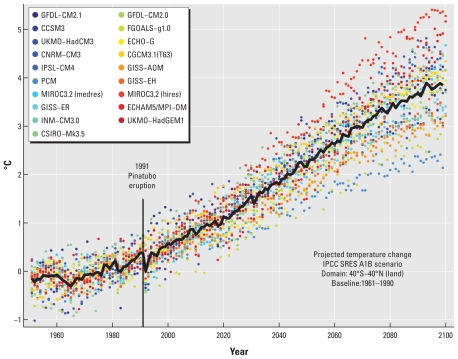
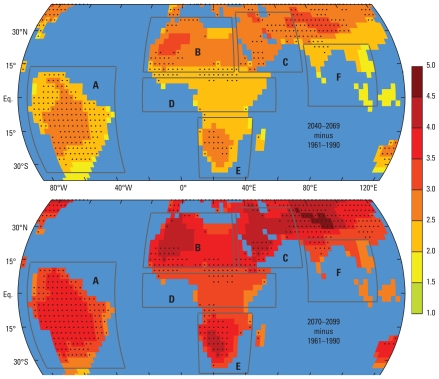
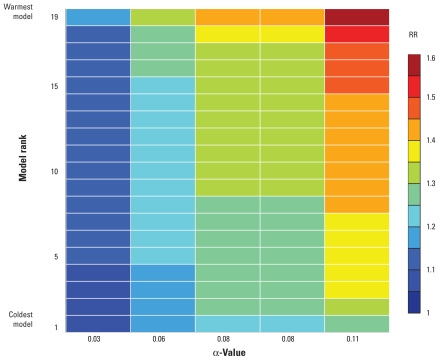
Methods: We combined a range of linear regression coefficients to compute projections of future climate change-induced increases in diarrhea using the results from five empirical studies and a 19-member climate model ensemble for which future greenhouse gas emissions were prescribed. Six geographical regions were analyzed.

Results: The model ensemble projected temperature increases of up to 4°C over land in the tropics and subtropics by the end of this century. The associated mean projected increases of relative risk of diarrhea in the six study regions were 8-11% (with SDs of 3-5%) by 2010-2039 and 22-29% (SDs of 9-12%) by 2070-2099.

Conclusions: Even our most conservative estimates indicate substantial impacts from climate change on the incidence of diarrhea. Nevertheless, our main conclusion is that large uncertainties are associated with future projections of diarrhea and climate change. We believe that these uncertainties can be attributed primarily to the sparsity of empirical climate-health data. Our results therefore highlight the need for empirical data in the cross section between climate and human health.


Figures

Figure 1
Figure 1
Temporal temperature projections for the tropics and subtropics. The black curve shows the ensemble average temperature from the 19 climate models under the A1B scenario, area averaged from 40°S to 40°N, and shown as annual changes with respect to the ensemble mean in the period 1961–1990. The colored dots show annual changes estimated by the individual models (see Table 1).
Figure 2
Figure 2
Spatial temperature projections for the tropics and subtropics. Temperature projections under the IPCC’s A1B scenario and with respect to 1961–1990 are shown for two time slices: 2040–2069 in the upper panel and 2070–2099 in the lower panel. Nineteen climate models were used, and the data were interpolated on a common grid. The unit is degrees Celsius, and the black dots show the grid cells for which the intermodel SD is higher than 0.5°C (top panel) and 0.7°C (bottom panel). The boundaries of regions are shown in dark gray: A, South America; B, North Africa; C, Middle East; D, equatorial Africa; E, southern Africa; F, Southeast Asia.
Figure 3
Figure 3
An example RR projection matrix. The projected changes to the RR of diarrhea, with respect to the 1961–1990 baseline, are shown for region B (North Africa as shown in Figure 2) for the period 2070–2099. The x-axis shows the five empirically derived increases in the RR of diarrhea for each 1°C temperature increase (α), and along the y-axis the 19 climate models are sorted with respect to the magnitudes of their projected warming.
Figure 4
Figure 4
Projected changes of diarrhea with climate change. The projected changes to the RR of diarrhea, with respect to the 1961–1990 baseline, are shown as empirical cumulative distribution functions (ECDFs) for regions A–F. In each plot, all the values in the RR projection matrices are shown for three time periods: 2010–2039 to the left, 2040–2069 in the middle, and 2070–2099 to the right. The values are shown with distinct colors according to the corresponding α-values, that is, the empirically derived increases in the RR for each 1°C temperature increase. Blue colors correspond to α = 0.03, turquoise to α = 0.06, yellow to α = 0.08 and orange to α = 0.11.

References

    1. Arnfield AJ. Two decades of urban climate research: a review of turbulence, exchanges of energy and water, and the urban heat island. Int J Climatol. 2003;23:1–26.
    1. Beggs PJ, Bambrick HJ. Is the global rise of asthma an early impact of anthropogenic climate change? Environ Health Perspect. 2005;113:915–919. - PMC - PubMed
    1. Campbell-Lendrum D, Woodruff R. Comparative risk assessment of the burden of disease from climate change. Environ Health Perspect. 2006;114:1935–1941. - PMC - PubMed
    1. Checkley W, Epstein LD, Gilman RH, Figueroa D, Cama RI, Patz JA, et al. Effects of El Niño and ambient temperature on hospital admissions for diarrhoeal diseases in Peruvian children. Lancet. 2000;355:442–450. - PubMed
    1. Collins M. Ensembles and probabilities: a new era in the prediction of climate change. Philos Transact A Math Phys Eng Sci. 2007;365:1957–1970. - PubMed

Publication types

MeSH terms