. 2010 Oct 29;330(6004):677-80.
doi: 10.1126/science.1196112. Epub 2010 Sep 30.

Polarized myosin produces unequal-size daughters during asymmetric cell division

Affiliations

Polarized myosin produces unequal-size daughters during asymmetric cell division

Guangshuo Ou et al. Science. .

Abstract

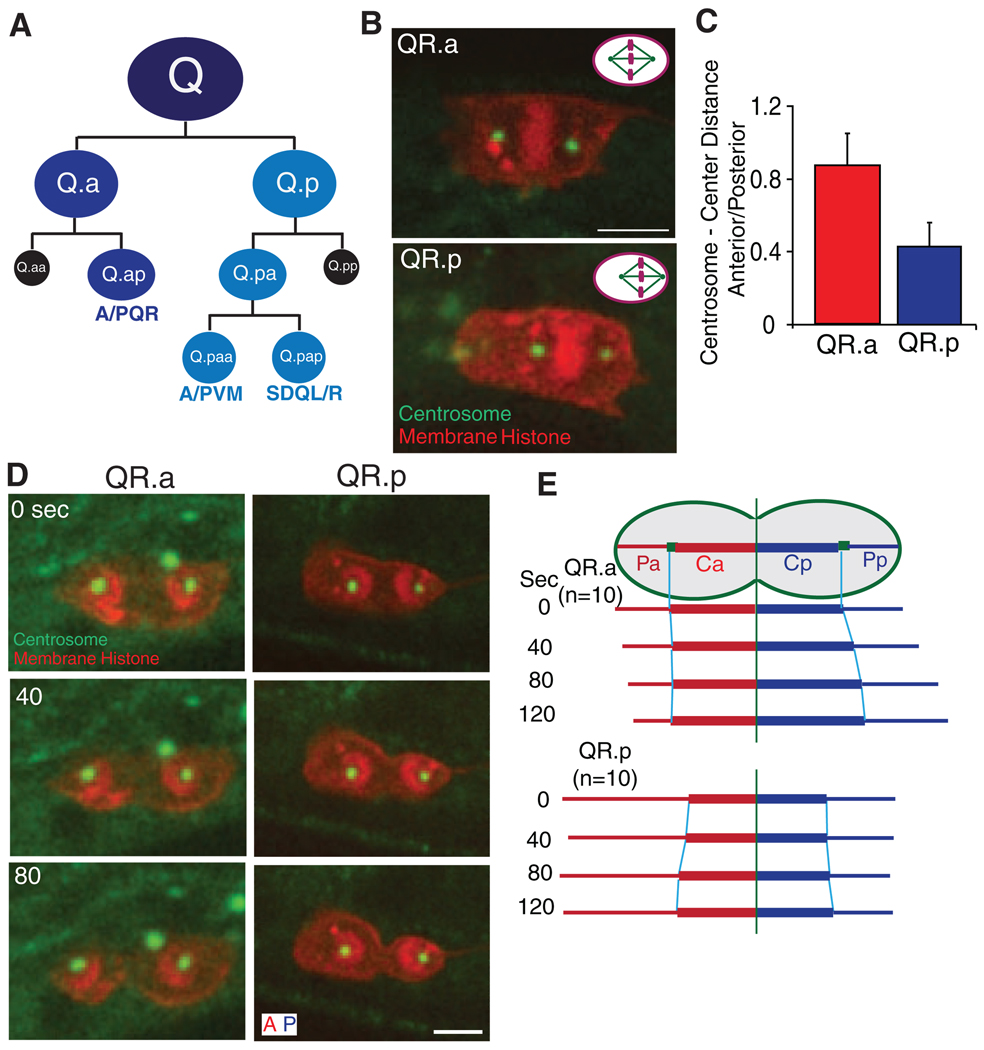
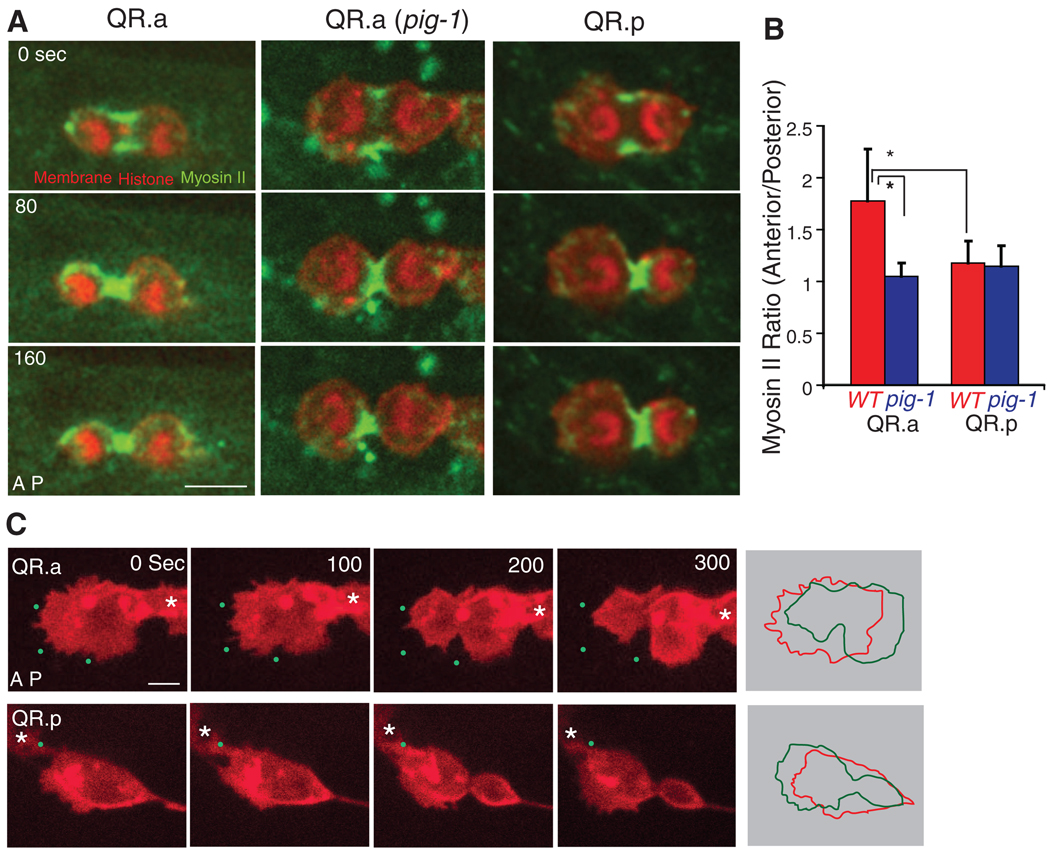
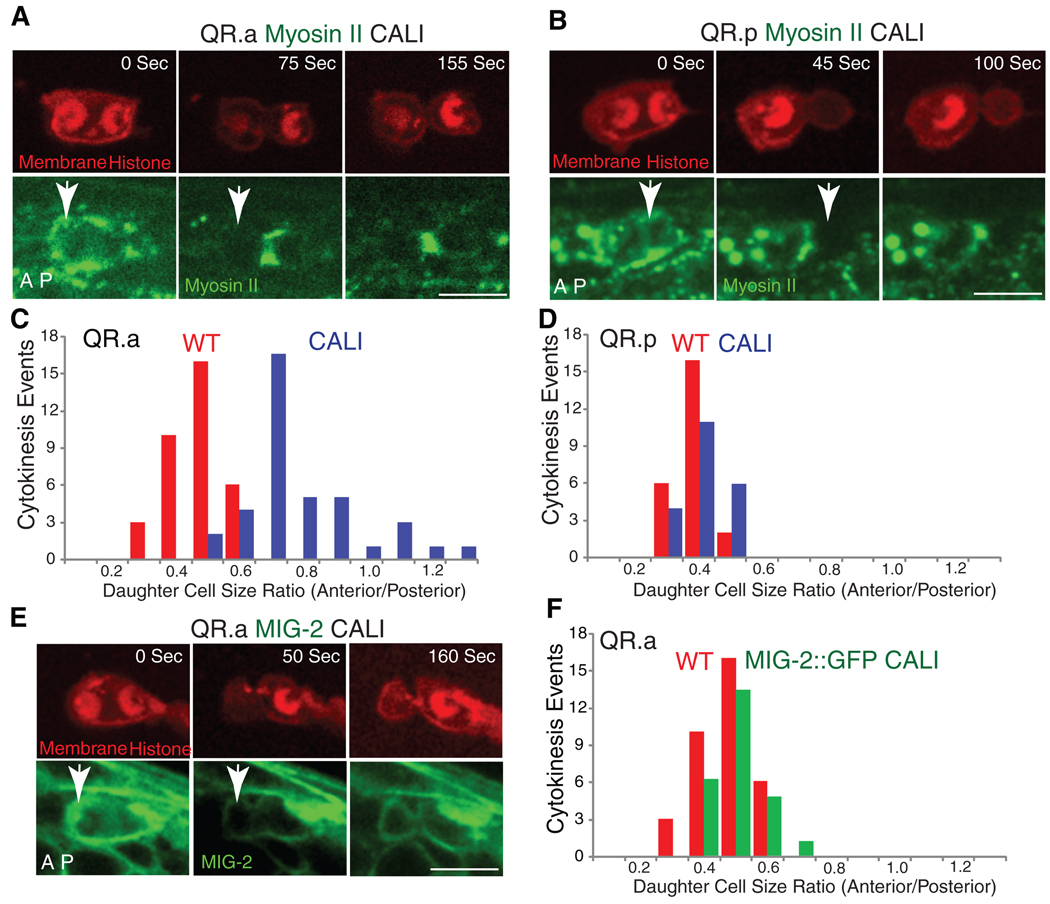
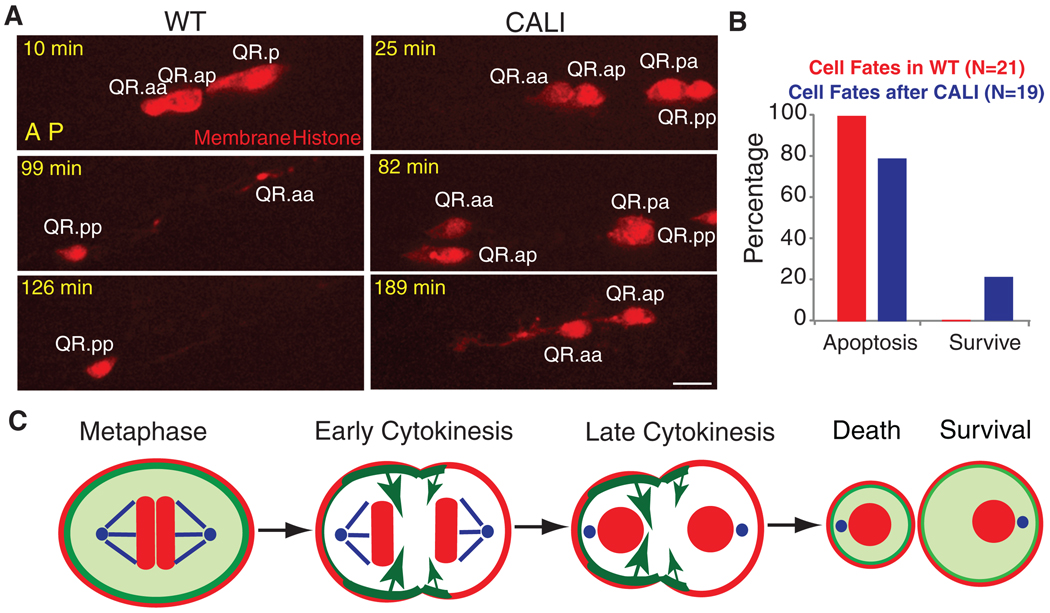
Asymmetric positioning of the mitotic spindle before cytokinesis can produce different-sized daughter cells that have distinct fates. Here, we found an asymmetric division in the Caenorhabditis elegans Q neuroblast lineage that began with a centered spindle but generated different-sized daughters, the smaller (anterior) of which underwent apoptosis. During this division, more myosin II accumulated anteriorly, suggesting that asymmetric contractile forces might produce different-sized daughters. Indeed, partial inactivation of anterior myosin by chromophore-assisted laser inactivation created a more symmetric division and allowed the survival and differentiation of the anterior daughter. Thus, the balance of myosin activity on the two sides of a dividing cell can govern the size and fate of the daughters.


Figures

Fig. 1
Fig. 1
C. elegans Q neuroblast lineage and spindle positioning in asymmetric cell division. (A) Three rounds of asymmetric cell divisions make three different neurons (QL generates PQR, PVM, and SDQL, whereas QR generates AQR, AVM and SDQR) and two apoptotic cells (in black). (B) Spindle positioning in the second-round division with centrosomes (γ-tubulin, TBG-1::GFP) in green and plasma membrane [mCherry with a myristoylation signal (12)] and histone (his-24::mCherry) in red. The cell anterior is toward the left. Bar, 2.5 µm. Upper right corners show a schematic summary of the results: QR.p spindle is displaced posteriorly but QR.a spindle is centered. (C) Centrosome–to–cell center distance ratio (anterior centrosome distance divided by posterior centrosome distance); data are shown as the mean ± SD (n = 12). Cell center is defined as the midpoint between the two cell poles. (D) QR.a (left) and QR.p (right) spindles during anaphase and cytokinesis. (E) The distance of the centrosome to the cleavage furrow (Ca, anterior; Cp, posterior) or to the cell pole (Pa, Pp). The distance is quantified from 10 movies and is normalized compared to the initial distances for each centrosome at the start of anaphase. Raw data are shown in fig. S1.
Fig. 2
Fig. 2
Myosin II and membrane dynamics in Q neuroblasts during cytokinesis. (A) Still images of myosin II–GFP dynamics during cytokineses of QR.a in wild-type (WT) or QR.a in pig-1 mutant and QR.p animals. (B) Myosin II–GFP fluorescence intensities ratio between the anterior and posterior parts of QR.a or QR.p cells in WT or pig-1 (gm344) mutant (*P < 0.001, n = 9 to 11); data are shown as the mean ± SD. (C) Membrane dynamics of QR.a or QR.p during cytokinesis. The plasma membrane is imaged as in Fig. 1. Green dots are autofluorescent spots in the C. elegans body that provide fiducial marks (original image not shown). Panels on the far right show the alignment of QR.a and QR.p cell peripheries (0 s red, 300 s green) revealing the contraction and expansion of the two sides of the cell. Asters show neighboring Q cells. More examples are shown in fig. S6. Anterior of the cell is toward the left. Bar, 2.5 µm.
Fig. 3
Fig. 3
Chromophore-assisted laser inactivation (CALI) of myosin II in Q neuroblasts during cytokinesis. (A) CALI inactivation of myosin II in the anterior of QR.a enlarges the anterior daughter cell size. Upper images show the chromosome and plasma membrane labeled with mCherry, and lower images show GFP-tagged myosin II. Arrows indicate the region that was treated with CALI at late anaphase (12). (B) CALI inactivation of myosin II in the posterior of QR.p does not change sizes of daughter cells. (C) and (D) are quantifications of the above CALI experiments. (E and F) CALI of MIG-2::GFP does not change the ratio of QR.aa and QR.ap. Anterior of the cell is toward the left. Bar, 5 µm.
Fig. 4
Fig. 4
Cell fate after CALI and a proposed model. (A) QR.aa cells normally undergo apoptosis (disappearance at 126 min). After CALI, QR.a cell migrated (82 min, the nonmotile QR.pp provides a fiduciary marker) and formed a neurite-like process (189 min). (B) Quantifications of QR.aa cell fates (12) in WT (red) and after CALI (blue) ~150 min after birth. Anterior of the cell is toward the left. Bar, 5 µm. (C) Proposed mechanism of QR.aa asymmetric division. Myosin II localizes evenly in QR.a cell at metaphase but distributes asymmetrically during anaphase. More myosin II at the anterior than at the posterior may generate larger cortical tension (long arrows), pushing cellular contents and resulting in a small cell in the anterior that undergoes apoptosis and a large cell in the posterior that survives. Myosin II (green); plasma membrane and chromosomes (red); centrosome and microtubules (blue).

Comment in

References

    1. Moore KA, Lemischka IR. Science. 2006;311:1880. - PubMed
    1. Neumüller RA, Knoblich JA. Genes Dev. 2009;23:2675. - PMC - PubMed
    1. Schneider SQ, Bowerman B. Annu. Rev. Genet. 2003;37:221. - PubMed
    1. Gönczy P, Pichler S, Kirkham M, Hyman AA. J. Cell Biol. 1999;147:135. - PMC - PubMed
    1. Gönczy P. Nat. Rev. Mol. Cell Biol. 2008;9:355. - PubMed

Publication types

Substances